
Market sentiment shifted sharply as Market’s hopes disproven became the dominant theme in global markets, after Iran denied claims of ongoing negotiations with the US.
The renewed uncertainty surrounding geopolitical tensions pushed oil prices higher once again, reversing earlier optimism and reinforcing concerns about prolonged inflationary pressures and market volatility.
Iran denies Trump’s claims pushing oil prices higher
Oil prices edged higher in today’s Asian session, despite tumbling yesterday. The drop of oil’s prices was caused by a post of US President Trump that negotiations are underway with Iran, are productive a deal could be made and US airstrikes are to stop for five days.
Yet Iran denied that negotiations are taking place, allowing uncertainty to re-emerge.
Analysts highlight the possibility the war dragging on until April, which may continue to support oil prices and maintaining worries for inflationary pressures.
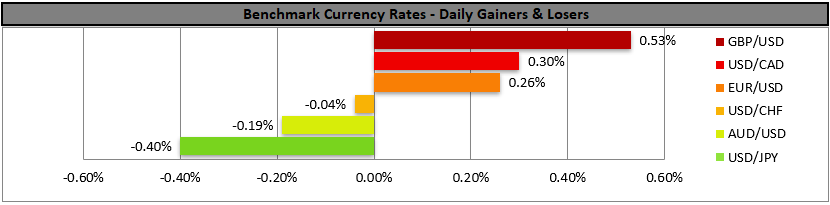
USD retreats before correcting higher
The USD strengthened slightly in the FX market in today’s Asian session after losing substantial ground yesterday due to Trump’s post.
Fundamentals may continue to lead the markets, yet Aussie traders may also keep a close eye on the release of Australia’s CPI rates for February in tomorrow’s Asian session. A possible acceleration of the rates could provide some support for AUD.
US stock markets rise
Dow Jones, Nasdaq and S&P 500 ended Monday in the greens as the market sentiment improved.
The drop of oil prices and the possibility of an end in the war in Iran all tended to support a more risk-on approach by the markets. Yet equity markets seem to proceed cautiously as conflicting signals for the issue emerge.
Gold recovers losses
Gold’s price recovered most of yesterday’s losses, as market worries for the war in Iran tended to calm, the USD weakened, and expectations for inflationary pressures eased temporarily.
We still expect substantial volatility in gold’s price to remain, with the war in Iran enhancing expectations for the Fed to keep its monetary policy tight, thus weighing on gold’s price.
Other highlights for today
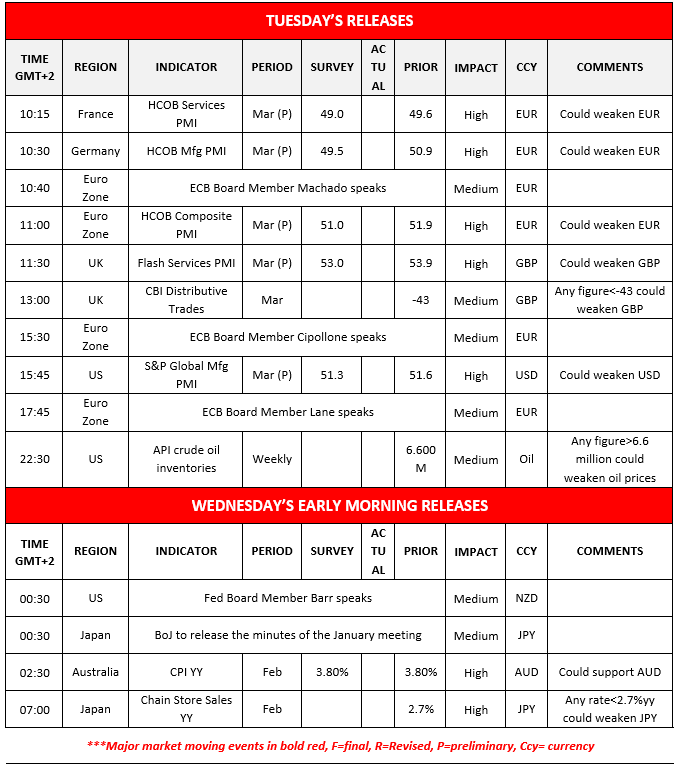
Today we get the preliminary March PMI figures of France, Germany, the Euro Zone as a whole, the UK and the US.
We also note the release of UK’s CBI indicator for March and the US API weekly crude oil inventories figure. On a monetary level, we note that ECB’s Machado, Cipollone and Lane are scheduled to speak.
In tomorrow’s Asian session Japan’s Chain Store Sales for the same month, while Fed Board Member Barr is scheduled to speak and BoJ is to release the minutes of the January meeting.
Charts to keep an eye out
XAU/USD
XAU/USD’s reversed yesterday’s losses breaking the 4250 (S1) resistance line, now turned to support. Yet the precious metal’s price remained below the downward trendline hence we maintain a bearish outlook for gold’s price at the current stage.
Should the bears remain in control, we may see gold’s price breaching the 4250 (S1) support line and start aiming for the 3890 (S2) support level.
For a bullish outlook to emerge, we require gold’s price to break the prementioned downward trendline and continue to break also the 4550 (R1) resistance line, setting the 4995 (R2) resistance level in its sights.
WTI
WTI’s price dropped yesterday breaking lower boundary of its past sideways motion, namely the 92.25 (R1) support line, now turned to resistance.
The intense downward motion of the commodity’s price forces us to temporarily switch our sideways motion bias, yet we note the discontinuance of the bearish movement in today’s Asian session, and the RSI indicator which has not breached below the reading of 50, implying an absence of a bearish market sentiment for WTI’s price.
Should the bulls be in the driver’s seat, we may see WTI’s price breaking the 92.25 (R1) resistance line and start actively aiming for the 100.90 (R2) resistance level.
Should the bears remain in charge, we may see WTI’s price breaking the 87.10 (S1) support line and start aiming for the 82.00 (S2) support level.
XAU/USD Daily Chart

- Support: 4250 (S1), 3890 (S2), 3600 (S3)
- Resistance: 4550 (R1), 4995 (R2), 5420 (R3)
WTI Daily Chart

- Support: 87.10 (S1), 82.00 (S2), 76.60 (S3)
- Resistance: 92.25 (R1), 100.90 (R2), 107.00 (R3)
إخلاء المسؤولية:
لا تُعد هذه المعلومات نصيحة استثمارية أو توصية بالاستثمار، وإنما تُعد تواصلاً تسويقيًا. لا تتحمل IronFX أي مسؤولية عن أي بيانات أو معلومات مقدمة من أطراف ثالثة تم الإشارة إليها أو الارتباط بها في هذا التواصل.


