

Since our last report ,oil prices seem to have corrected a bit higher over the past two days and today we are to discuss the main issues that seem to be tantalising traders currently and conclude the report with a technical analysis of WTI’s daily chart.
The US oil market remains loose
The US oil market data suggest relative slack, as the halt in the rise of active US rigs indicates some hesitation in demand.
All indicators tend to align in pointing out that aggregated demand in the US oil market was not able to catch up with production levels. Should such signals intensify in the coming week, we may see them having a bearish effect on oil prices.
US Trade wars clip oil demand outlook
It seems that the US-led trade wars are about to clip the international demand outlook. At least that’s what the International Energy Agency (IEA) is saying in its Oil Market Report for March 2025. IEA also seems pessimistic for oil demand stemming from China as in an article published by the Agency, it sees Chinese demand reaching a plateau.
Overall further signs of an easing demand side for the international oil market could continue weighing on prices. Thus we highlight the US trade wars as a key determinant of oil prices.
We adopt the notion that the trade wars could decrease economic activity and thus ease oil demand. Signs of rising trade tensions or slowing global growth could pressure black gold’s price fundamentally.
OPEC+’s unwinding of production cuts
(OPEC’s sign) On the flip side, OPEC+ seems to maintain its demand outlook which could be considered a positive for oil prices. Yet we also note the increased production from Kazakhstan and expect the oil cartel to start unwinding its oil production cuts. As it believes that oil demand remains steady. Further signals of increased OPEC oil production could weigh on prices by easing supply chain strain.
Overall fundamental conclusion
Overall we see the case for fundamentals to maintain their negative effect on prices in the coming week.
Oil Technical Analysis
WTI Cash Daily Chart
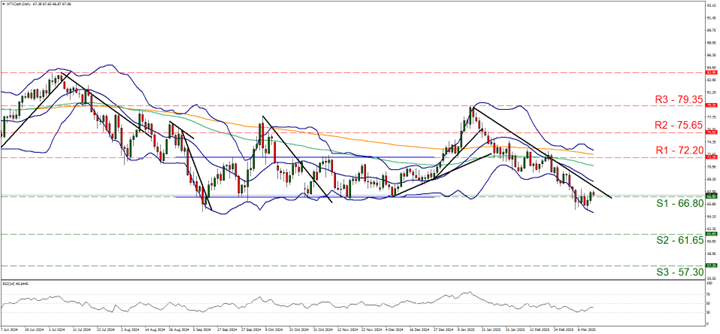
- Support: 66.80 (S1), 61.65 (S2), 57.30 (S3)
- Resistance: 72.20 (R1), 75.65 (R2), 79.35 (R3)
WTI’s price was positioned just below the 66.80 (S1) support line for most of the days since our last report yet yesterday broke above it and turned it back to a support line.
Despite the correction higher which was somewhat expected given the flirtation of the price action with the lower Bollinger Band. We tend to maintain our bearish outlook for the commodity’s price as long as the downward trendline guiding it, since the 16 of January remains intact.
Should the bears maintain control over the commodity’s price, we may see its price action breaking the 66.80 (S1) clearly and use it as a resistance line to attack the 61.65 (S2) support level.
Should the bulls take over, we may see WTI’s price extending their correction higher to initially break the prementioned. Downward trendline in a first signal that the downward motion has been interrupted and continue to aim if not breach the 72.20 (R1) resistance line. With the next possible target for the bulls being the 75.65 (R2) resistance level.
سلب مسئولیت:
This information is not considered investment advice or an investment recommendation, but instead a marketing communication. IronFX is not responsible for any data or information provided by third parties referenced or hyperlinked in this communication.


