


(WTI) Oil price appears to have stabilised somewhat since our last report.
In today’s report we are to have a look at fundamental issues that could alter its direction, including the US peace plan for the war in Ukraine, OPEC’s intentions, and the state of the US oil market.
We are to conclude the report with a technical analysis of WTI’s daily chart.
US peace plan for Ukraine negotiations tend to weigh on oil prices
The negotiations for the US peace plan for the war in Ukraine tend to weigh on WTI prices, as a scenario of the peace plan being agreed upon would possibly unlock exports of Russian oil production, thus flooding the international oil market’s supply chains. Substantial progress has been reported in the negotiations, yet there are still some obstacles on the road to peace.
One thorn the persists is Ukraine’s refusal to cede some areas to Russia, which it considers as strategic. It should be noted that the Russians are still slowly advancing and a potential abandoning of Ukraine by the US could cause the Ukrainian defence to collapse. As US President Trump was reported stating, “The way it’s going, if you look, it’s just moving in one direction.
So eventually that’s land that over the next couple of months might be gotten by Russia anyway”. On the flip side, we still are skeptical for a possible peace deal at the current stage as the two sides, but especially Russia may lack sufficient incentive to actually reach an agreement.
Should we see further signs of the peace plan progressing we may see oil prices retreating further while on the flip side, should the negotiations fall through oil prices could get substantial support.
Data from the US oil market remain mixed
In the US data for the oil market tend to remain mixed. On Friday Baker Hughes oil rig count ticked up to 419 active oil rigs, a positive signal of a possibly increasing oil demand in the US.
The positive signals were further enhanced on Tuesday as API reported a drawdown of US oil reserves of -1.9 million barrels, in a sign that aggregated oil demand in the US exceeded oil production levels.
Yet the picture of a possibly tightening US oil market was overturned on Wednesday as EIA reported an increase of US oil inventories by 2.774 million barrels. Should we see further signs of a tightening US oil market we may see the oil prices getting some support and vice versa.
OPEC’s intentions
Also we note that on a direct producer level in the international oil market, OPEC’s intentions remain key regarding the commodity’s price direction.
Please bear in mind that the market is allready considered oversupplied, the possibility of Russia overflowing the market adds more pressure on oil prices and it was reported that on Sunday OPEC had a meeting at which it was common consensus that oil production levels are to remain unchanged.
It should be noted that the alliance has increased oil production in the past few months. Yet keeping oil production levels unchanged may intensify the flow of oil in the markets thus we consider OPEC’s intentions currently, as bearish for oil prices.
Yet another issue for OPEC at the current stage would be price vulnerability, which for the past few weeks has been one sided to the lower side, which may cause second thoughts among key member like Saudi Arabia, hence that should be one risk the market should bear in mind.
Market’s expectations for the Fed to cut rates may support oil prices
Albeit not directly related to the oil market the market’s expectations for the Fed to proceed with a rate cut in the December meeting tend to limit the losses for oil prices.
On a fundamental level, that could be explained by the notion that the lower rates would encourage an increase of economic activity in the US including the industrial sector thus increasing the demand for oil. Thus any intensification of the market’s dovish expectations for the Fed could continue supporting oil prices.
Oil Technical Analysis
WTI Cash Daily Chart
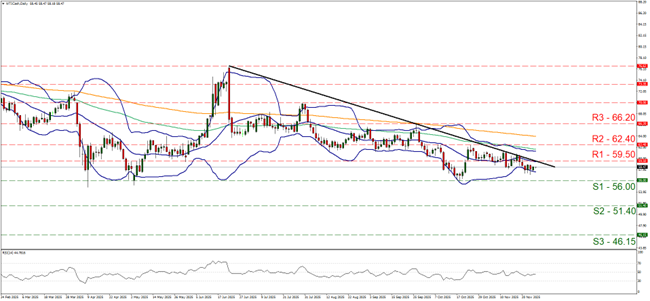
- Support: 56.00 (S1), 51.40 (S2), 46.15 (S3)
- Resistance: 59.50 (R1), 62.40 (R2), 66.20 (R3)
WTI’s price action seems to have stabilised somewhat over the past few days between the 59.50 (R1) resistance line and the 56.00 (S1) support level. Nevertheless, the downward trendline guiding the commodity’s price since the 23 of June remains intact hence our bearish outlook is maintained.
The RSI indicator tends to remain below the reading of 50, implying a continuance of a bearish market sentiment for the commodity, yet is not as convincing and given the relative stabilisation of WTI’s price over the past few days we issue a warning for the emergence of a sideways motion scenario, possibly between the 56.00 (S1) support line and the 59.50 (R1) resistance line.
For the bearish outlook to be maintained for WTI’s price action it would have to form a new lower trough which would imply that the commodity’s price action has to break the 56.00 (S1) support line and start aiming for the 51.40 (S2) support level.
For a bullish outlook to be adopted the bar is high as WTI’s price action would have to break the prementioned downward trendline in a first signal that the downward motion has been interrupted and continue to break also the 59.50 (R1) resistance line and reach if not breach the 62.40 (R2) resistance base.
Avertissement :
Ces informations ne doivent pas être considérées comme un conseil ou une recommandation d'investissement, mais uniquement comme une communication marketing


