

Since our last report ,oil prices seem to have moved slightly higher since the opening of the markets of Monday. However, the most recent announcement about a possible deal between the US and Iran may be taking the spotlight away from OPEC’s monthly report that was released yesterday. In the current report we are to discuss the conditions characterising the US wti market currently, as well as factors affecting wtidemand and supply in the international oil market. We are to complete the fundamentals included in the report with a technical analysis of WTI’s chart.
Bearish signals from the US oil market
We make a start by noting that some aspects of the US oil market show signs of tightening. Starting with the Baker Hughes oil rig count last Friday which showcased a decrease in the number of active wti rigs in the US, which tends to be a bearish sign for oil prices.
Specifically, it showcased a decrease in oil rig count by two, implying that supply in the US oil market may be exceeding demand . Moreover, it’s characteristic that the API and EIA reported an unexpected increase of US oil inventories by 4.287 million barrels and 3.454 million barrels, respectively.
The reports by the two oil agencies painted a clear picture in the oil market, which in turn may have weighed on oil prices. Thus, should both agencies showcase a continuation of the increase in oil inventories in the coming week, it may continue weighing on the price of oil. On the flip side, should the showcase a decrease in inventories it may instead aid oil prices.
US-Iran deal on the horizon?
According to a flurry of media reports earlier on today, US President Trump said that the US was close to securing a nuclear deal with Iran.
In particular the President stated that “we’re in very serious negotiations with Iran for long-term peace”, implying that a nuclear deal between the US and Iran might be on the horizon. In our view, for Iran to agree to a nuclear deal, it may involve the US restricting sanctions on Iran which may also include the removal of sanctions on Iran’s oil exports.
Thus such a possibility could result in the increase of the supply of oil into the international market, which may be facilitated by the removal of export controls on Iranian oil. In turn, this may weigh on oil prices as the supply of oil may overshadow the existing demand.
However, with a report by Reuters stating that Iranian officials consider the halting of uranium enrichment as a ”red line”, we remain skeptical to the true terms of a possible deal and if there will be one.
OPEC has released its monthly report for May
During yesterday’s American trading session. In the report, OPEC notes that sequential economic growth is expected to decelerate in the second quarter of 2025 and the second half of 2025 “reflecting external headwinds from elevated tariffs”.
At a first glance, the release by OPEC showcases that they expect a possible reduction in economic growth for the second quarter and half of 2025, which in turn may imply a reduction in demand for oil, which may have weighed on oil prices. However, the report goes on to state that “the recent agreement between China and the US…. offers additional support to China’s short-term growth outlook”, therefore given China’s status as the world’s largest oil consumer, a boost in their short term growth outlook could imply an increase in demand for oil, which may have aided oil prices.
Oil Technical Analysis
WTI Cash Daily Chart
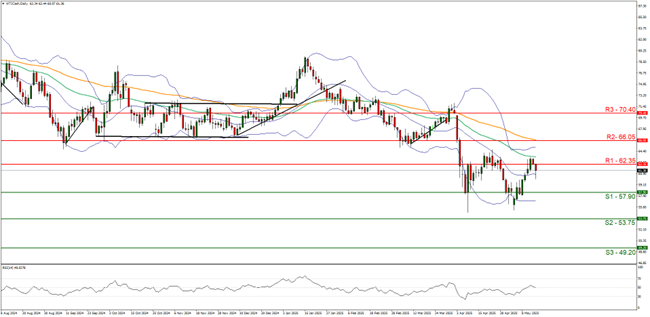
- Support: 57.90 (S1), 53.75 (S2), 49.20 (S3)
- Resistance: 62.35 (R1), 66.05 (R2), 70.40 (R3)
WTI’s appears to be moving in a sideways fashion after moving back below our 62.35 (R1) resistance level. We opt for a neutral outlook for the commodity’s price and supporting our case is the RSI indicator below our chart which currently registers a figure near 50, implying a neutral market sentiment.
For our sideways bias to continue, we would require the commodity’s price to remain confined between the 57.90 (S1) support level and the 62.35 (R1) resistance line.
On the other hand, for a bearish outlook we would require a clear break below the 57.90 (S1) support level with the next possible target for the bears being the 53.75 (S2) support line. Lastly, for a bullish outlook we would require a clear break above the 62.35 (R1) resistance line with the next possible target for the bulls being the 66.05 (R2) resistance level.
Avertissement :
Ces informations ne doivent pas être considérées comme un conseil ou une recommandation d'investissement, mais uniquement comme une communication marketing


