

WTI’s two-week rally seems to have ended yet that remains to be seen. In contrast to our previous report, we tend to focus on the situation of the US oil market and also keep an eye out on China, as well as the international supply side of the oil market. In this report, we aim to shed light on the catalysts driving WTI’s price, assess its future outlook and conclude with a technical analysis.
Oil: Overview Report
The situation in the US oil market
We note last week’s comment about the problems in the supply side of the US oil market given the freezing weather. Yet Baker Hughes reported an increase in the number of active oil rigs by two, implying a small rebound on the production side of the US oil market and a pick up of demand. API on the other hand, reported a wider than expected drawdown in US oil inventories, yet API’s data were contradicted one day later as EIA reported an increase of oil inventories, implying a slight slack in the US oil market. The big picture seems to be shifting as in the week before we had a rather solid picture of a tight US oil market, yet now the signals we get are rather mixed. It seems that the US oil production sector is slowly restarting its engines and should the widening of the US oil reserves reflect the increase of production, we may see it having an adverse effect on oil prices.
Chinese riddles
On the demand side we noted in the last report the stimulus package prepared by the Chinese Government, yet note that the January PMI indicators for the manufacturing sector continue to be discouraging. It’s characteristic that the NBS manufacturing PMI figure increased slightly yet remained below the reading of 50 implying another contraction of economic activity for the past month.
On the other hand, the Caixin manufacturing PMI figure edged lower yet remained above the cut-off point of 50, implying a slight increase in economic activity for the sector. Once again we interpret the mixed signals sent by the indicators as signs that Chinese factories are still struggling to increase economic activity and thus placing doubt on a substantial increase in oil demand, which in turn may weigh on oil prices.
The supply side and OPEC
On the supply side of the international oil market, we note that OPEC’s oil output in January registered the widest monthly drop in six months according to Reuters. Understandably the largest decline stemmed from Libya given the social unrest that forced a shutdown of a major oil field in the country. Normally we would expect Libyan production to rebound in the coming month, which in turn may widen the supply side of oil and thus weigh on its prices.
Yet OPEC may have the final say as in a meeting today, the organization is discussing the implementation of its planned production cuts. For the time being the organization is not expected to alter its production plans and given that the already announced production plans have been priced in by the market we may see the result weighing on oil’s price.
Oil: Technical Analysis
WTI Cash H4
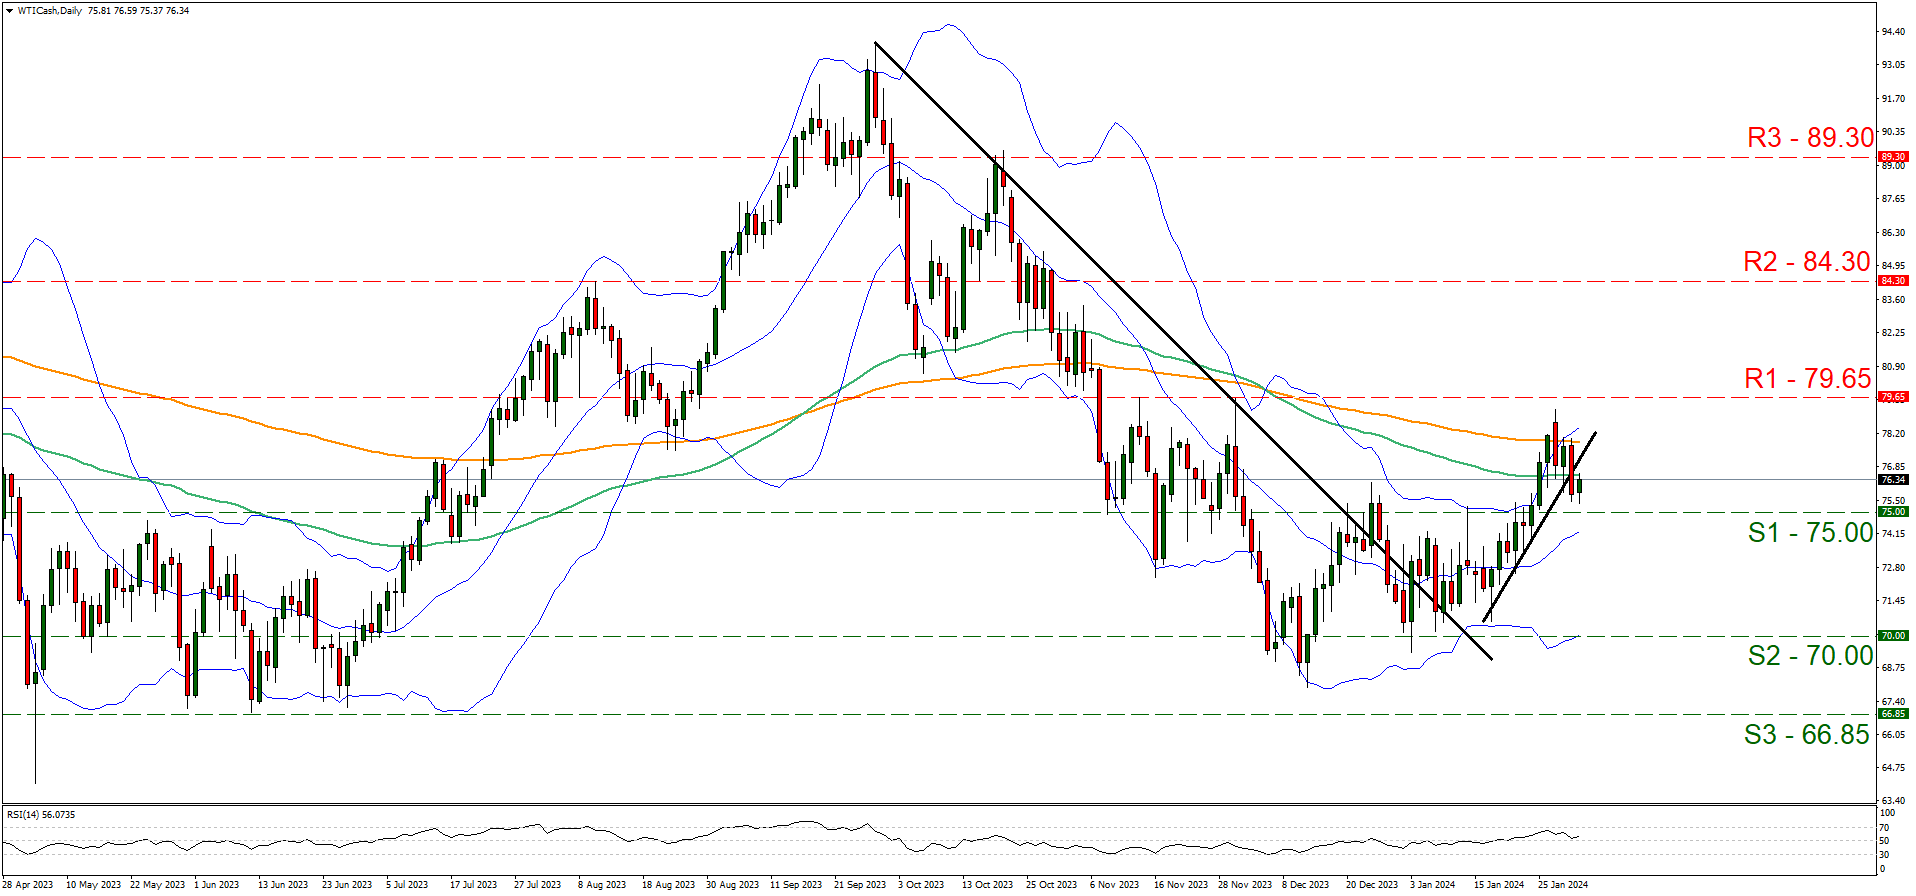
- Support: 75.00 (S1), 71.00 (S2), 66.85 (S3)
- Resistance: 79.65 (R1), 84.30 (R2), 89.30 (R3)
As the commodity’s price was aiming for the seventy-nine point sixty-five resistance line, the bulls seem to have gotten cold feet and the price action rolled down yesterday near the seventy-five dollar support line. An interesting element is that as WTI’s price rolled down, it broke the upward trendline guiding it for the past two weeks, signaling an interruption of the upward movement. Hence we switch our bullish outlook in favour of a sideways movement bias initially.
We also note that the RSI indicator remained close but above the reading of 50, which highlights the fading of the bullish sentiment in the market. Yet for the bullish outlook to reemerge we would require the price action of WTI to reach a higher level than the last peak, thus to practically break the seventy-nine point sixty-five resistance line and thus opening the gates for the eighty-four point three resistance nest. On the flip side, should the bears take over, we may see WTI’s price breaking the seventy-five support line and taking aim at the seventy-one support base.
免責事項:
This information is not considered investment advice or an investment recommendation, but instead a marketing communication. IronFX is not responsible for any data or information provided by third parties referenced or hyperlinked, in this communication.


