前週、ゴールドはプラス圏で取引を終えたものの、過去1ヶ月の大半において観察された横ばい状態を脱することはできませんでした。今週は、ゴールドは小幅に下落していますが、トレーダーの中には高値圏での安定を求める心理が働いているようで、ゴールドには依然として注目が集まっているようです。このレポートでは、現在ゴールド市場を動かしている重要な事柄について、当社の視点から概要を説明します。トレーダーがゴールド市場での取引を成功させることができるよう、簡潔ながらも分析的なプレゼンテーションを提供することを目的としています。最後に当社は、ゴールドのテクニカル分析を行い、重要なレベルや可能なトレンドのシナリオを示す予定です。
現在、市場の関心は、今年度第1四半期の暗い見通しに向けられています。米国や中国など世界最大の経済各国は、個人消費と企業の成長や投資にとって大きな脅威となるオミクロン変異株の広がりにまだ対処している最中です。昨日発表された中国の経済指標によると、第4四半期の中国本土の年間GDP率は前回の4.9%から4.0%へと低下しました。この数字は依然として高いものの、減速は大きく、2022年の前半に起こる可能性のある事態の前兆とも考えられます。しかし、中国における最も重要な進展は、月曜日に中国の中央銀行が2020年4月以来初めて中期貸付金の借入コストを10ベーシスポイント引き下げ、2.95%から2.85%にしたことで、これは予想を裏切る動きでした。中国の予想外の金利引き下げは、その将来の成長に何らかの不確実性を示唆している可能性があります。これは、中国経済の状況が最近悪化し、中央銀行に他の選択肢がないことを示すものでもあります。金価格は、おそらくこの展開の結果として、月曜日のアジアセッションである程度のサポートを受けたと見られます。
米国では、インフレ圧力は依然として非常に強く、投資家は起こりうる損失をカバーするために戦略を調整している可能性があります。前週、米国の週間消費者物価指数は0.5%にとどまりましたが、年間のヘッドラインとコアレートはそれぞれ7.0%と5.5%となり、上昇に転じました。インフレ率の上昇は、物価上昇から生じるリスクをヘッジするための材料として、金の需要を高める傾向にあります。このニュースが発表されると、金は上昇しましたが、かなり抑制された形で推移しました。同時に、米国では、市場参加者たちは、連邦準備制度が近い将来に利上げを実施することを期待しています。利上げは、現在懸念されているインフレ圧力に対抗するための有効な手段であるため、市場から幅広い期待を集めています。ただし、もし市場がさらなる情報を入手し、FRBによる利上げが近いうちに実施されると見込んだ場合、金のトレーダーは注文を出すために相当な行動を起こすと予想されます。しかし、現段階では、金には予測不可能な性質があることから、パンデミックに関する展開に影響されやすいと予想されます。
As our final part of the fundamental analysis we note the upcoming US financial releases that can possibly move Gold’s price in the following days. On the 19th of January we get the US Housing Starts Number for December, while on the 20th we get the US Philly Fed Business Index for January, the weekly initial Jobless claims figure and the Existing Home Sales figure for December. In the next week on Monday the 24th we get the very important Flash Markit Manufacturing and Services figures for January. Finally, on the 25th we get the US Consumer Confidence figure for January.
テクニカル分析
XAU/USD H4

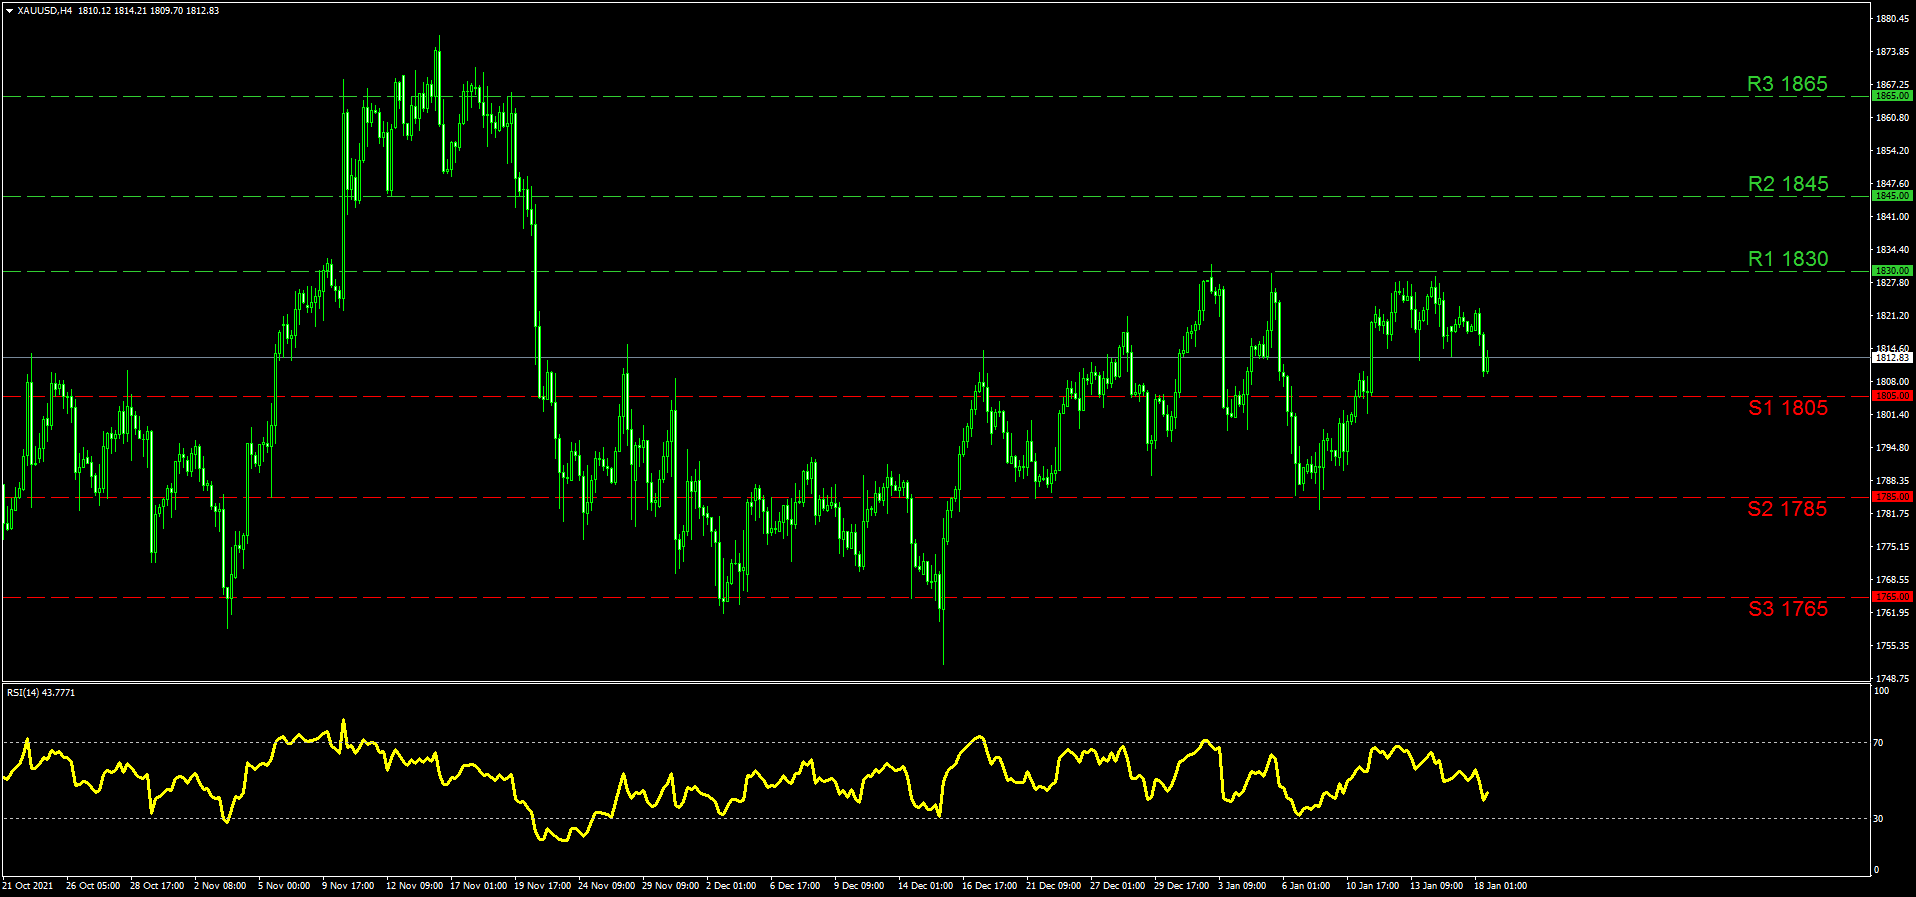
Gold continues to move in a wide sideways motion between the (R1) 1830 resistance and the (S2) 1785 support level. These levels have both been tested but not breached in January making them important for traders to keep in mind. The top, the (R1) has been tested clearly two times in January and was closely approached a third time on the 14th, making it a crucial barometer for Gold’s price further appreciation. If the price action does break above the (R1) then the (R2) 1845 level can be tested first. Our highest resistance line is noted at the (R3) 1865 level that was used as a high back in November. In the opposite direction, if a selling interest arises we could see Gold moving closer to the (S1) 1805 support level that was used previously as a resistance. The price action, has risen above and submerged below the (S1) various time since December thus traders may have to use it with alertness due to the fact that it may be ignored occasionally. Lower, as we noted stands the very distinguished (S2) 1785 level which has not been breached to the downside for more than a month. At the end we keep the (S3) 1765 line as our lowest support and can be used as a pending order or a target in an extensive selling strategy. The RSI indicator remains above 30 for the time being confirming the bearish tendencies in the short-term. Overall we tend to maintain a sideways bias yet a break above the (R1) could signal bullish tendencies for Gold while a move below the (S1) could invite bearish ones.
この記事に関する一般的な質問やコメントがある場合は、次のリサーチチームに直接メールを送信してください。research_team@ironfx.com
免責事項:
本情報は、投資助言や投資推奨ではなく、マーケティングの一環として提供されています。IronFXは、ここで参照またはリンクされている第三者によって提供されたいかなるデータまたは情報に対しても責任を負いません。


