
WTI bulls seem to have continued to push the commodity’s price higher and despite a correction lower yesterday and today, WTI’s price are still higher than our last report. For the time being, we intend to have a look at the conditions in the US oil market yet also have a look at the supply and demand sides of the international oil market. In this report, we aim to shed light on the catalysts driving WTI’s price, assess its future outlook and conclude with a technical analysis.
Oil: Overview Report
US oil market remains tight
Making a start with the conditions in the US oil market, we have to note that the number of active US oil market increased according to Baker Hughes by 6. The increase of active oil rigs in the US tends to imply that demand is on the rise, especially if one considers that active oil rigs have been increasing the past four-five weeks. API on the other hand, reported that US oil inventories continued to drop, in the past week by -1.519 million barrels with the release implying that aggregated demand surpassed production levels, thus that the US oil market remains tight after prior week’s readings first reversed the slack reported in the past month in the US oil market.
It should be noted that EIA’s crude oil inventories figure reaffirmed the tightness of the US oil market, by reporting also a drawdown, this time of -1.952 million barrels. Should next week’s readings reaffirm the US oil market’s tightness we may see oil prices getting some support.
The Fed’s decision
On a deeper fundamental level, we note the Fed’s interest rate decision. The bank as was widely expected remained on hold and seemed to verify that rate cuts are coming. Yet in its accompanying statement, the bank also showcased some hesitancy in cutting rates. Furthermore, the new dot plot verified the market’s current expectations for a total of three rate cuts in the year which also tended to weigh on the USD.
So on the one hand, the weakening of the USD tends to usually support oil prices, given that the commodity is primarily denominated in US Dollars. Also, the possibility of easing financial conditions could improve economic activity thus increasing demand for oil. Both of the prementioned factors tended to be supportive of oil prices. On the other hand, the bank’s hesitation to start cutting rates may imply a prolongment of tight financial conditions in the US economy and could have weighed a bit on oil prices.
Is Russian supply tightening of loosening?
As the last fundamental issue on an international level this time, we note the situation with Russian oil exports. Reports surfaced at the beginning of the week that Russian exports of oil for March are expected to have increased by 10% on a daily basis, if compared to the initial plans. Increased exports seem to be going out from the country’s Baltic ports.
On the flip side, we highlight the Ukrainian drone attacks against Russian refineries, which may curtail oil supply on an international level. Also please note that US sanctions on Russian oil seem to be taking place as Reuters reported that India’s Reliance Industries, operator of the world’s biggest refining complex, will not buy Russian oil loaded on tankers operated by shipper Sovcomflot (SCF) after recent U.S. sanctions.
The news tended to highlight the prospect for additional tightening of the supply side of the international oil market and should such headlines intensify in the coming week, we may see them supporting oil prices fundamentally.
Oil: Technical Analysis
WTI Daily Chart
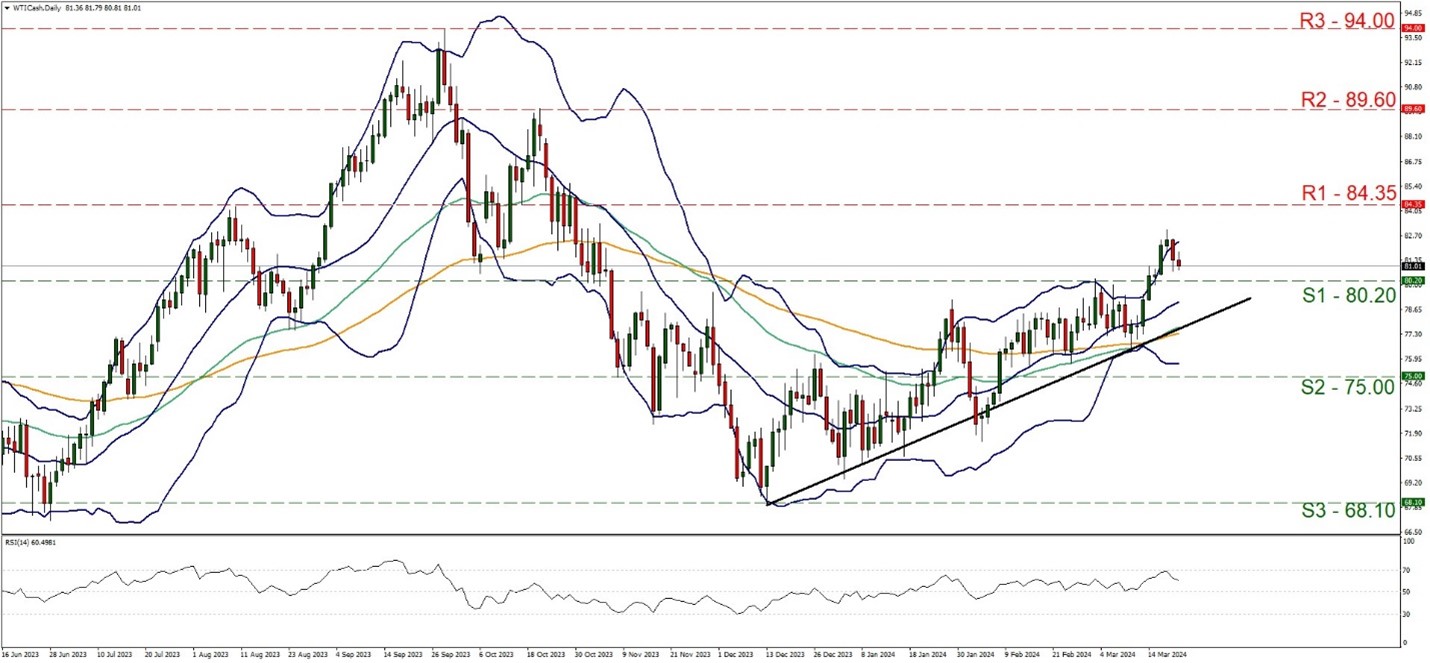
- Support: 80.20 (S1), 75.00 (S2), 68.10 (S3)
- Resistance: 84.35 (R1), 89.60 (R2), 94.00 (R3)
The recent upward motion of WTI’s price seems to have been interrupted, and the commodity’s price action over the past two days, pointing towards the 80.20 (S1) support line. For the time being, we tend to treat the lowering of oil’s price action as a correction, given that the upward trendline guiding it since the 13 of December last year, remains intact and despite the lowering of the RSI indicator, its reading is still above the reading of 50, which may imply that the bullish sentiment has eased yet may have not completely left the market.
A correction lower should be expected given that the price action was flirting with the upper Bollinger bands. Also note how the 20 moving average (MA), the median of the Bollinger bands, the 50 MA (green line) and the 100 MA (orange line) all are pointing upwards. Even the 50 MA has proceeded to a bullish cross over the 50 MA. Hence for the time being we tend to maintain our bullish outlook for WTI’s price action for now. Should the bulls actually maintain control over the commodity’s price action, we may see WTI’s price reversing the losses of yesterday, forming a higher high, possibly testing if not breaching the 84.35 (R1) resistance line. Should the R1 be broken we set as the next possible target for the bulls the 89.60 (R2) resistance hurdle.
For a sideways motion bias to emerge, we would like to see WTI’s price action breaking the 80.20 (S1) support line, breaking the prementioned upward trendline, signaling the interruption of the upward movement, yet respecting the 75.00 (S2) support level. Should the price action also break the 75.00 (S2) support level, we highlight as the next possible target for the bears the 68.10 (S3) support barrier.
免責事項:
This information is not considered investment advice or an investment recommendation, but instead a marketing communication. IronFX is not responsible for any data or information provided by third parties referenced or hyperlinked, in this communication.


