

Oil prices have moved higher this week ,since our last report. Today, we are to discuss the recent trade deal announcements and the ultimatum given to Russia and their trading partners, as well as the weekly state of the US oil market . The report is to be concluded with a technical analysis of WTI’s daily chart.
Trade war worries ease, with Russia now in the US’s crosshairs
The US’s August 1st tariff deadline is tomorrow. Yet since our last report the EU and the US have agreed to trade deal terms. Per the White House, “The deal bolsters America’s economy and manufacturing capabilities. The EU will purchase $750 billion in U.S. energy and make new investments of $600 billion in the United States, all by 2028.”
Furthermore, the US will impose a 15% tariff on European exports to the US, yet the “sectoral tariffs on steel, aluminum and copper will remain unchanged”. Moreover, on the trade deal front, according to Reuters, the US and China this Tuesday have agreed to seek an extension of their 90-day tariff truce, which was set to expire in mid-August.
Although we should note that President Trump still needs to approve the aforementioned extension. Overall, the easing of market worries about a possible trade war occurring with the EU post August 1st appears to have diminished.
Thus, with market worries about a possible hindrance of global economic growth easing, oil prices may have gained as a result.
However, President Trump’s decision to reduce the deadline for Russia to agree to a peace agreement with Ukraine from 50 days to 10-12 days may have also spooked market participants about possible supply chain constraints.
Specifically, the US has threatened Russia of sanctions and of secondary tariffs of up to 100% on countries that continue to import Russian crude, hence raising worries about oil supply constraints, which may have aided oil prices during the week.
In our opinion, the prevailing issue for oil traders currently may be the tariff threats for countries affiliated with the purchasing of Russian crude and given President Trump’s “mood swings” oil traders may face a highly volatile market in the coming weeks.
In addition, we raise the question, that even if the US decides to impose tariffs on China for purchasing Russian oil, will it persuade China to “abandon” Russia? or will China push back as it did when the US first attempted to take them on “Liberation Day”. In our view, the US’s threats on China may be another attempt to gain some negotiation leverage for their trade talks, although that could instead result in unproductive trade talks down the line.
US oil market loosens
Making a start with the data on the ground of the US oil market, we note that last Friday, Baker Hughes has continued to report a reduction of active oil rigs in the US from 422 to 415. It’s notable that it’s the 13th weekly drop of the indicator’s reading with no signs of stopping, signaling once again that demand in the US oil market is easing which in turn may be bearish for oil prices.
Furthermore, on Tuesday the API weekly crude oil inventories showcased an unexpected increase in the US oil inventories which may imply that supply exceeded demand and thus could be seen as a bearish for oil prices.
Moreover, the EIA weekly crude oil inventories figure confirmed our aforementioned theory after showcasing a much higher increase in weekly oil inventories. In turn it appears that all three “indicators” in regards to the state of the US oil market have finally converged, showcasing a loosening US oil market which may be bearish for oil prices.
Oil Technical Analysis
WTI Cash Daily Chart
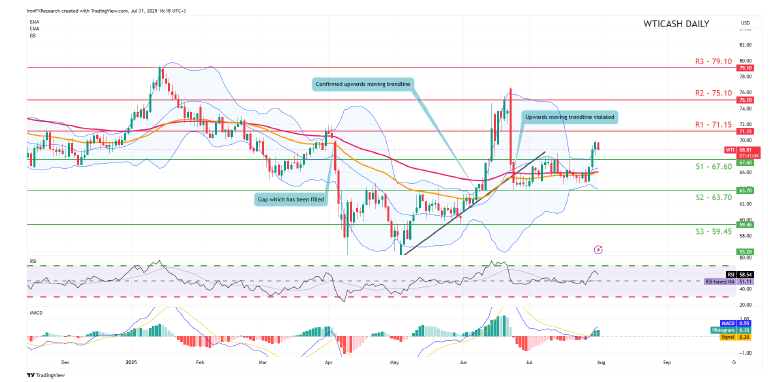
- Support: 67.60 (S1), 63.70 (S2), 59.45 (S3)
- Resistance: 71.15 (R1), 75.10 (R2), 79.10 (R3)
WTI’s price appears to be moving in an upwards fashion. We opt for a bullish outlook for the commodity’s price and supporting our case is the RSI indicator below our chart which currently registers a figure near 60 which tends to imply a bullish market sentiment, as well as the MACD indicator below our chart.
Yet, we would not be surprised at all to see oil’s price moving to test our 67.60 (S1) support level. Nonetheless, for our bullish outlook to continue we would require a clear break above our 71.15 (R1) resistance line with the next possible target for the bulls being the 75.10 (R2) resistance line.
On the other hand for a bearish outlook we would require a clear break below our 67.60 (S1) support level with the next possible target for the bears being the 63.70 (S2) support line. Lastly, for a sideways bias we would require the commodity’s price to remain confined between the 67.60 (S1) support level and the 71.15 (R1) resistance line.
免責事項:
This information is not considered investment advice or an investment recommendation, but instead a marketing communication. IronFX is not responsible for any data or information provided by third parties referenced or hyperlinked in this communication.


