
The US-Iran ceasefire agreement calms the markets, easing supply-side fears and pushing oil prices sharply lower below $100/barrel.
The deal also boosted risk-on sentiment, weakening the USD and supporting equities and cryptocurrencies, while gold gained modestly on the softer greenback.
Oil prices tumble below $100/barrel
Iran and the US managed to reach a ceasefire deal, just hours before the US deadline. The ceasefire deal is to have a duration of two weeks and is to provide time for a more permanent deal to be reached. Iran is to allow safe passage for ships through the Straits of Hormuz in that period, which was the main issue for the US.
The news of the deal caused oil prices to tumble as a major factor of uncertainty for the supply side of the international oil market has been removed for the time being. It should be noted that in the FX market, the USD was on the retreat across the board, with the Aussie being one of the main beneficiaries.
The greenback’s safe-haven qualities was the main determinant of its direction. Also, the enhancement of the risk-on market sentiment tended to support riskier assets, such as equities, which rallied, while the cryptocurrency market also got some support.
Also please note that the gold’s price benefited from the weakening of the USD, albeit the gains made by the precious metal’s price may have been somewhat capped.
Fed’s meeting minutes could also prove to be a market mover
Despite the US-Iranian ceasefire deal being the major fundamental issue for the markets, we also note the release of the Fed’s March meeting minutes as a potential market mover later today.
The Fed in its March meeting remained on hold as was widely expected, yet at the same time signalled that it was prepared to keep rates unchanged for longer.
In the minutes we are to see the various opinions expressed by Fed policymakers and despite some being clearly on the dovish side, like Miran and others being hawkish like Schmid, our interest falls on the balance of power which is formed within the Fed.
Should the document show that the majority is concerned more about inflationary pressures in the US economy rather than jobs and is prepared to keep rates high for longer, we may see the USD getting some support, while gold’s price and US equities could be on the retreat.
本日のその他の注目点
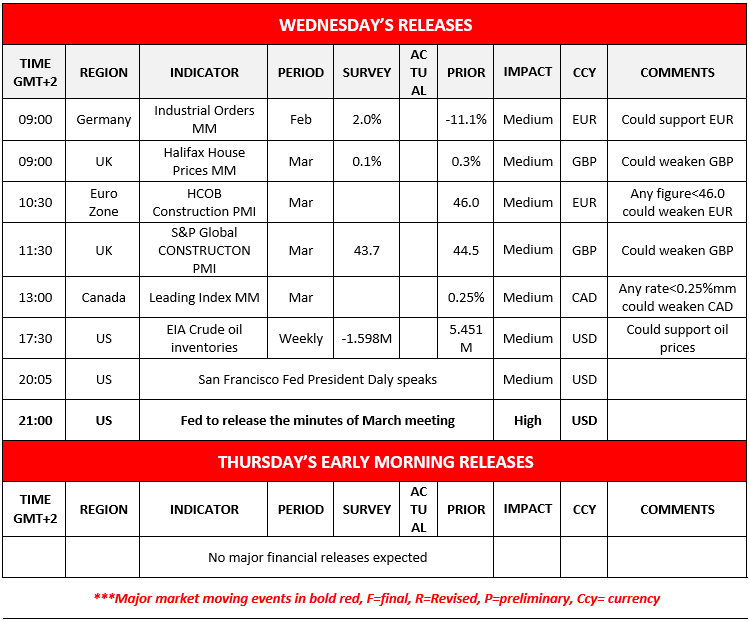
Today we get Germany’s industrial orders for February, UK’s Halifax House prices for March, the UK’s and the Euro Zone’s March construction PMI figures, Canada’s leading index for March and the US weekly crude oil inventories figure.
On a monetary level, besides the release of the Fed’s March meeting minutes we also note that San Francisco Fed President Daly speaks.
Charts to keep an eye out
WTI
WTI’s price tumbled below $100/barrel in today’s Asian session, interrupting its upward motion.
As the drop of WTI’s price has clearly broken the upward trendline guiding it, we switch our bullish outlook in favour of a sideways motion bias for the time being, albeit we also warn for a possible continuance of the bearish movement.
Should the bears take over, we may see WTI’s price breaking the 93.80 (S1) support line and start aiming for the 87.10 (S2) level. Should the bulls take over, which we consider as a remote scenario currently, we may see WTI’s price breaking the 100.90 (R1) resistance line and start aiming for the 107.00 (R2) level.
S&P 500
S&P 500 rallied yesterday breaking clearly the 6715 (S1) resistance line, now turned to support. The RSI indicator rose above the reading of 50, implying a bullish market sentiment for the index and given S&P 500’s upward movement allows us to adopt a bullish outlook for the index.
Should the bulls continue to lead the index’s price action, we may see it reaching if not breaching the 7015 (R1) resistance line in the next few days. Yet the index’s price action has reached the upper Bolinger Band which could slow down the bulls if not cause a correction lower.
Should the bears take over, we may see S&P 500’s price action reversing the gains made, breaking the 6715 (S1) support line and start aiming for the 6490 (S2) support level.
WTI Daily Chart

- Support: 93.80 (S1), 87.10 (S2), 82.00 (S3)
- Resistance: 100.90 (R1), 107.00 (R2), 112.70 (R3)
US 500 Cash Daily Chart

- Support: 6715 (S1), 6490 (S2), 6210 (S3)
- Resistance: 7015 (R1), 7250 (R2), 7500 (R3)
免責事項:
本情報は、投資助言や投資推奨ではなく、マーケティングの一環として提供されています。IronFXは、ここで参照またはリンクされている第三者によって提供されたいかなるデータまたは情報に対しても責任を負いません。