

Oil prices appear to be in the green’s since the beginning of the week. In this report we are to examine fundamental issues affecting oil prices such as the state of the US oil market and the upcoming US inflation print, and we are to conclude the report with a technical analysis of WTI’s daily chart.
Mixed signals from the US oil market
We make a start with the comment about the state of the US oil market by noting that the number of active oil rigs in the US decreased by one from 412 back to 411. The decrease in our view is immaterial. Yet should the number of active oil rigs continue to decrease it could be perceived as a sign of reduced oil demand and thus for an impact to be seen on oil prices, the overall picture may have to change.
On Tuesday we got the API weekly crude oil inventories figure which showcased a smaller drawdown than expected -0.947 million barrels. On Wednesday the aforementioned narrative appears to have been countered by the EIA which reported a wider drawdown of US oil inventories for the past week, by coming at -2.392 million barrels. The contradicting indicators may have led to heightened volatility highlight in the oil markets yet the overall narrative could weigh on oil prices should it continue in the upcoming week.
US Inflation data tomorrow
The US PCE rates for July are set to be released during tomorrow’s American session and could possibly garner significant attention from market participants. Given their importance to the Federal Reserve which uses the PCE rates as their primary gauge of inflationary pressures in the US economy, the anticipated acceleration on a core level from 2.8% to 2.9% could also negatively influence oil prices. In particular, an uptick in inflationary pressures could increase calls for the
Fed to maintain their restrictive monetary approach, which could possibly maintain the tight financial conditions surrounding the US economy and which could then weigh on oil prices. However, should the inflation print showcase easing inflationary pressures it may have the opposite effect and could thus aid oil prices.
Oil Technical Analysis
WTI Cash Daily Chart
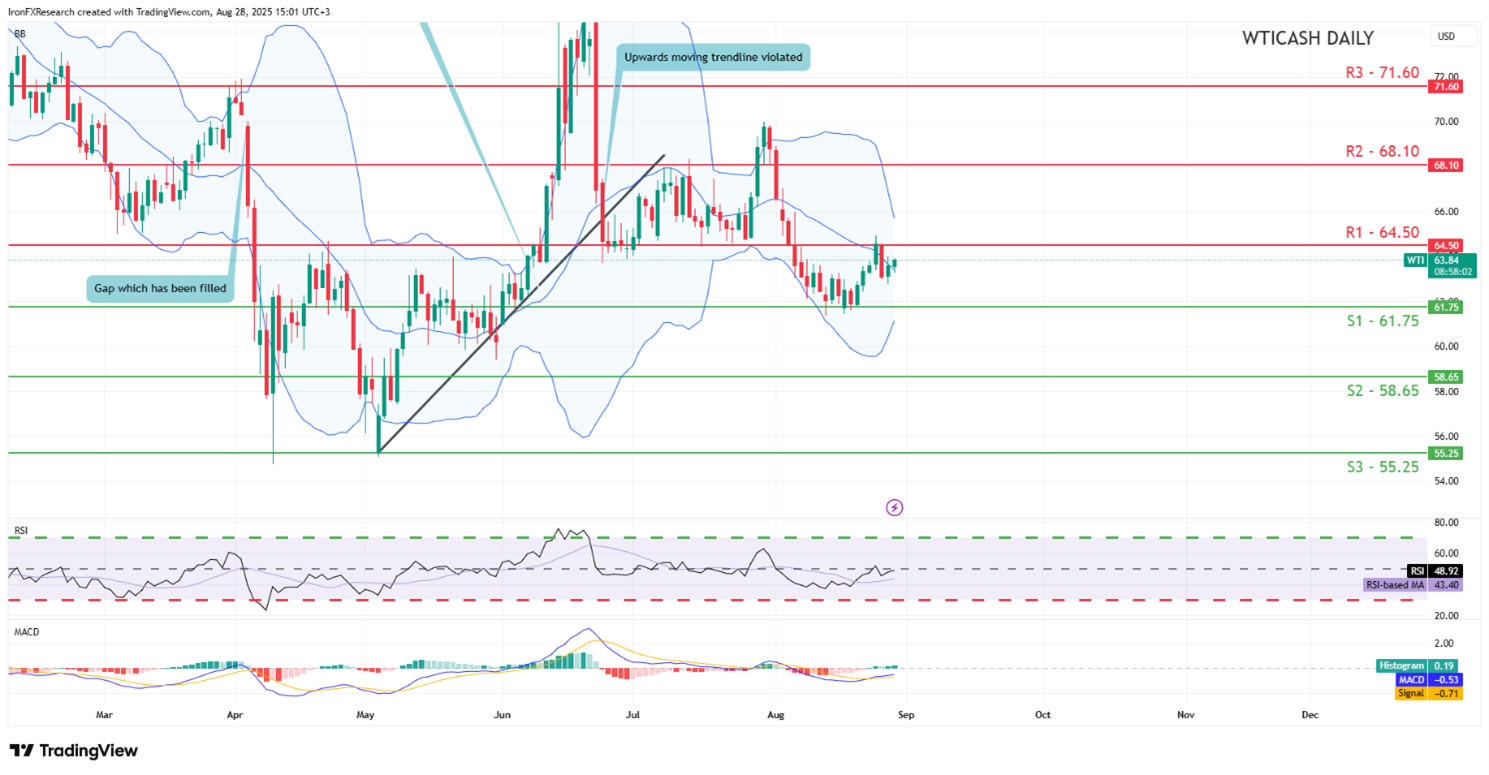
- Support: 61.75(S1), 58.65(S2), 55.25(S3)
- Resistance: 64.50(R1), 68.10 (R2), 71.60 (R3)
WTI’s price appears to be moving in a sideways fashion. We opt for a sideways bias for the commodity’s price and supporting our case is the RSI indicator below our chart which currently registers a figure near 50 implying a neutral market sentiment.
For our sideways bias to be maintained we would require the commodity’s price to remain confined between the 61.75 (S1) support level and the 64.50 (R1) resistance line.
On the other hand for a bullish outlook we would require a clear break above the 64.50 (S1) support level with the next possible target for the bulls being the 68.10 (R2) resistance line. Lastly, for a bearish outlook we would require a clear break below our 61.75 (S1) support level with the next possible target for the bears being the 58.65 (S2) support line.
Disclaimer:
This information is not considered investment advice or an investment recommendation, but instead a marketing communication. IronFX is not responsible for any data or information provided by third parties referenced or hyperlinked in this communication.


