

The halt of the drop of WTI’s price action may have been the main characteristic of the commodity’s price action over the past week. In today’s report we are to have a look at the state of the US oil market, OPEC’s intentions and geopolitical issues which could affect oil prices. The report is to be concluded with a technical analysis of WTI’s daily chart for a rounder view.
US oil market loosens up
Making a start with the current state of the US oil market, we note that last Friday Baker Hughes reported a reduction of active oil rigs in the US by 2, in a sign of an easing of oil demand in the US oil market.
The signals for a loosening up of the US oil market were further enhanced as API on Tuesday reported an increase of US oil inventories by 2.78 million barrels, ending a streak of three weekly drawdowns which implied that aggregated demand in the US oil market was not able to catch up with oil production levels.
Similarly yesterday EIA reported also an increase of US oil inventories by an even wider number than API, at 3.715 million barrels, indirectly verifying the existence of a slack in the US oil market. Should we see further signals of a loosening US oil market we may see oil prices slipping once again.
OPEC+’s modest oil production hike
Maybe the main event that halted the drop of oil prices was OPEC+’s decision for a moderate oil production hike. OPEC+’s decision on Sunday weas for an oil production increase of 137k barrels per day (bpd). As per OPEC sources cited by Reuters the level of the oil production hike decided was one of the smallest options discussed among OPEC members.
The decision was taken amidst worried for a possible oversupply by OPEC that could cause oil prices to tumble. Saudi Arabia is to deliver 41k bpd, almost a 30% of the total oil production increase decided and Russia another 41k, showing that the concentration of the oil production hike is high. It seems that Saudi Arabia is strategically moving towards regaining its market share, which in turn may risk the oil producing giant overproducing oil, possibly more than any quota which is set. For the time being we note that the market has priced in OPEC’s intentions yet any further signals of overproduction by OPEC members could weigh on oil prices in the coming days.
Geopolitics which could possibly affect WTI prices
Geopolitics today have been dominated by the Gaza ceasefire deal. The deal practically comprises a road map for Israel and Hammas to reach a permanent ceasefire that would allow for the return of the hostages and at the same time end military operation in Gaza and allow for humanitarian aid to enter the Gaza strip.
The deal was celebrated by both Israelis and Palestinians, yet in our opinion remains fragile. Nevertheless, should there be signs of the deal being applied and progress being made for a more permanent ceasefire, we may see market worries for oil supply lines easing and thus there could a bearish effect for oil prices.
The second geopolitical issue under oil traders magnifying glass, may be the war in Ukraine. Peace negotiations seem to be stalling, which in turn may enhance hostilities further.
At the same time US sanctions on Russian oil may intensify further, possibly having an adverse effect on European oil purchases from Russia.
On the other hand we have to note that China, India and Turkey are reported to have increased substantially their purchases of Russian oil.
Hence we may see the US and the EU sanctions targeting Indian and Chinese customers of Russian oil producers. It’s characteristic that US sanctions were applied on the Serbian (Russian owned) oil company NIS, in a painful reminder for the long arm of the US in hitting Russian oil interests which are considered to be funding the war in Ukraine.
Overall the US sanctions on Russian oil are considered as bullish for oil prices, hence should the intensify we may see oil prices gaining.
Oil Technical Analysis
WTI Cash Daily Chart
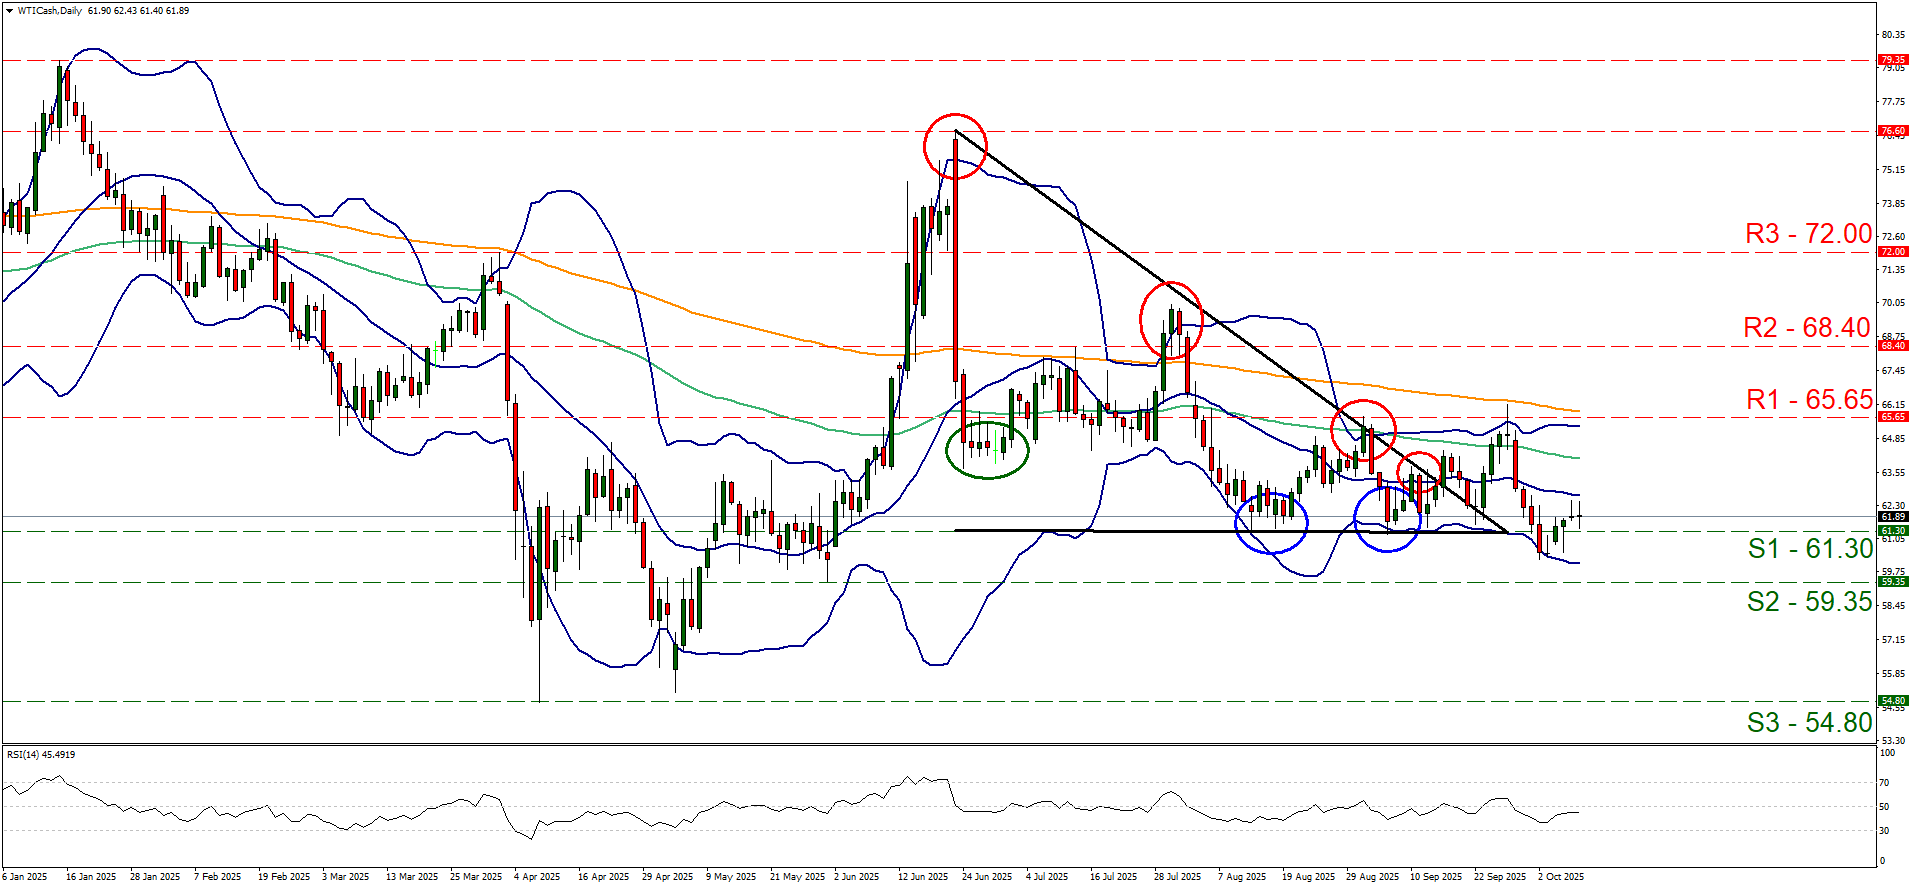
- Support: 61.30 (S1), 59.35 (S2), 54.80 (S3)
- Resistance: 65.65 (R1), 68.40 (R2), 72.00 (R3)
Since our last report the main characteristic of WTI’s technical analysis may be the halting of the drop of the commodity’s price action. WTI’s price action over the past week recovered some ground and surfaced just above the 61.30 (S1) support line showing some signs of stabilisation.
The RSI indicator has risen yet remains below the reading of 50, implying an easing of the market’s bearish sentiment for the commodity’s price.
Hence we reverse our prior bearish outlook in favour of a sideways motion bias once again. For our bearish outlook to re-emerge we would require a clear break below our 61.30 (S1) support level and continue to break also the 59.35 (S2) support base, with the next possible target for the bears being the 54.80 (S3) support barrier, which marks also the lowest point WTI’s price action has reached in our chart.
On the other hand for a bullish outlook, we would require a break above our 65.65 (R1) resistance line with the next possible target for the bulls being the 68.40 (R2) resistance level.
Disclaimer:
This information is not considered investment advice or an investment recommendation, but instead a marketing communication. IronFX is not responsible for any data or information provided by third parties referenced or hyperlinked in this communication.


