

Gold’s price continued to rise since our last report and highlighting the precious metal’s bullish tendencies, its price reached new record high levels.
Please note that we are entering the winter holiday season in the Americas and Europe, given Christmas and New Year celebrations, which implies that a number of trading desks are to be empty, thus thin trading conditions may apply over the next two weeks, which in turn may enhance unexpected and wide moves of the precious metal’s price, to either direction.
In today’s report we are to discuss fundamental issues affecting gold’s price such as the market’s expectations for the Fed, geopolitical tensions and the validity of the negative correlation of the USD with gold’s price.
We are also adding a technical analysis of gold’s daily chart at the end of the report for a rounder view.
The market’s dovish expectations for the Fed
One of the factors supporting gold’s price over the past week have been the increased expectations for the Fed to cut rates in the coming year. Currently Fed Funds Futures (FFF) imply that the market expects the bank to proceed with two more rate cuts in the coming year, once in April and once in July.
Please note that Fed policymakers in their last dot-plot had signalled that they expect only one more rate cut, in the coming year, hence one could deduce that the market’s expectations at the current stage are more dovish than what the Fed policymakers expect.
Should we see the market’s dovish expectations intensify we may see gold’s price getting additional support in the coming days and the contrary a possible easing of the market dovish expectations for the Fed’s intentions could weigh on gold’s price.
Geopolitical tensions are maintained
Since our last report we note that gold’s price may have also gotten support from safe haven inflows generated from an escalation of tensions on a geopolitical level. The war in Ukraine is ongoing, despite the efforts of the US for a possible ceasefire, and at the current stage we see little incentive for either side to actually reach a peace deal.
Hence we may see the US escalating the pressure on the two sides further, which may intensify uncertainty in the markets and in turn increase safe haven inflows for the precious metal. Also we highlight the tensions in the US-Venezuelan relationships as a factor that could potentially affect gold’s price.
We note that since our last report, the US has seized a second ship while media report that the US is in pursuit of a third vessel. On the other hand Venezuela has decided to provide escort with its Navy to any oil tankers given the US blockade and actions.
The situation is at a very delicate stage and possibility of US military operations on the ground of Venezuela cannot be excluded, which would signal further escalation of the tensions and thus could provide additional support for gold’s price.
Last but not least we also note a flare up of tensions between Israel and Iran, with Israeli PM Netanyahu visiting the US next week seeking to discuss with US President Trump a possible attack on Iran while Iran on the other hand is conducting missile exercises. A possible new flare up of tensions, or another Israel-Iran war could also provide support for gold’s price.
On the contrary should we see an easing of market worries for the three prementioned issues we may see gold’s price suffering a retreat.
Negative correlation of the USD with gold’s price inactive
Since our last report we note that gold’s price has been steadily on the rise, yet the USD initially strengthened and then retreated against its counterparts in the FX Market.
Despite the two trading instruments following the same direction in the past week, the opposite occurred yesterday and today in the European session.
For the time being we do not see the negative correlation of gold to the USD as being active and its characteristic that the release of the better than expected US GDP advance rate for Q3 earlier today, despite providing some support for the USD at the time of its release, failed to affect gold’s price.
Gold Technical Analysis
XAU/USD Gold H4 Chart
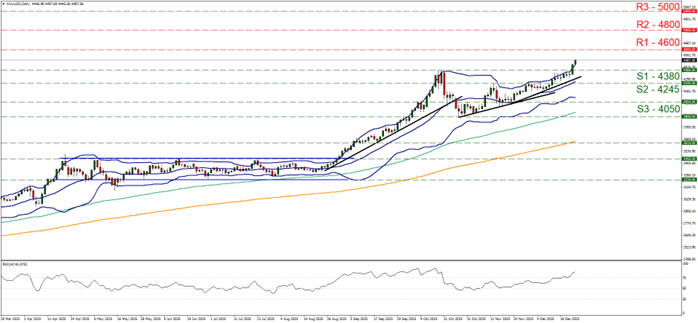
- Support: 4380 (S1),4245 (S2),4050 (S3)
- Resistance:4600 (R1), 4800 (R2), 5000 (R3)
Since our last report, Gold’s price continued to rise, breaking the 4380 (S1) resistance line, now turned to support, reaching new All Time High (ATH) levels. We maintain a bullish outlook for the precious metal’s price as the upward trendline, which was initiated on the 28th of October and has steepened its upward slope since the 21st of November, remains intact. Yet at the same time, we intensify our warning for a possible correction lower of the precious metal’s price.
The RSI indicator remains above the reading of 70, actually reaching 81, signaling a strong bullish market sentiment for gold’s price, while at the same time highlights that gold’s price has reached overbought levels and is ripe for a correction lower. Similar signals are coming from the price action well surpassing the upper Bollinger band.
Should the precious metal’s price continue to rise, we set as the next possible target for the bulls the 4600 (R1) resistance line. Should the bears take over we may see gold’s price dropping, breaking initially the 4380 (S1) line and continue lower to break the prementioned upward trendline in a first signal of an interruption of the upward movement and then continue to break the 4245 (S2) support level, thus paving the way for the 4050 (S3) support barrier.
Disclaimer:
This information is not considered investment advice or an investment recommendation, but instead a marketing communication. IronFX is not responsible for any data or information provided by third parties referenced or hyperlinked in this communication.


