

WTI bears seem to be hesitating since yesterday allowing for a temporary stabilisation of the commodity’s price. In today’s report we are to have a look at the improvement of the US Sino trade relationship but also the Fed’s latest interest rate decision, the state of the US oil market, the sanctions on Russian oil and OPEC’s oil production intentions, all being on a fundamental level. On a technical level, we are to provide a technical analysis of WTI’s daily chart.
Improvement of US-Chinese trade relationships could support oil prices.
The Trump-Xi meeting seems to be leading to an improvement of the US-Sino trade relationships. Trump came out of the meeting, stating that the meeting was “amazing”. From the first reports it seems that the US is to lower tariffs imposed on imports from China, China is to ease the restrictions of rare earths to the US and China is to restart massive purchases of US Soybeans among others.
Overall the meeting seems to have served as to agreeing a framework of a potential trade deal between the two superpowers and tends to act as to thaw tensions in the US-Sino trade relationships. On the negative side, there seems to be a lack of structural changes, while the actual agreement is still to be formed.
In any case the direction currently seems to be towards an improvement that could lead to an increase of economic activity and oil thus oil demand and the improved market expectations and optimism could provide some support for oil prices.
The state of the US oil market
Continuing with the state of the US oil market, Baker Hughes last Friday reported an increase of active US oil rigs in a signal of possibly increased oil demand in the US economy which could serve as a bullish signal for oil prices. On Tuesday API reported a drawdown of -4.0 million barrels, showcasing that oil demand surpassed oil production in another bullish signal for oil.
Yesterday we got another bullish signal as EIA reported an even wider drawdown of US oil inventories than API, of -6.858 million barrels. Should we see further depletion of US oil inventories in the coming week, we may see oil prices getting some support.
The Fed cuts rates again but limits the easing?
The Fed as was widely expected cut rates by 25 basis points yesterday, yet Fed Chairman Powell set doubts on the December meeting expected rate cut. At the moment the market has eased its expectations for the bank to continue easing its monetary policy yet they are still there.
In any case we expect the rate cut yesterday to ease financial conditions in the US economy further that could lead to increased economic activity and thus increase demand for oil, supporting the commodity’s price. Yet such expectations for an increase in oil demand could be moderated should Fed policymakers start stressing their doubts for the necessity of an extensive rate cutting path.
OPEC’s intentions for oil production and US sanctions on Russian oil
Reports are highlighting the possibility of OPEC actually leaning on another oil production hike, yet as the last one also rather modest. Specifically Reuters sources spoke of another 137k barrels per day (bpd) oil production increase in December, a decision which follows a similar oil production hike for November.
News of the oil producers’ organisation hiking production levels, tends to weigh on oil prices as it increases oil supply.
Ther e is nothing new that the US has sanction Russian oil, what is new is that the German branch of Rosneft (sanctioned Russian oil company) has been exempted, in what seems to be a crack in US sanctions. Indian refineries seem to have halted the import of Russian oil until they get a green light to proceed from the Indian Government, while at the same time International Energy Agency (IEA) General Secretary Birol stated that the effect of the US sanctions is to be limited because of surplus capacity that can make up for the lost oil quantities.
Under normal circumstances the US sanctions could provide support for oil prices, as they theoretically limit the supply of the commodity in the international markets.
Oil Technical Analysis
WTI Cash Daily Chart
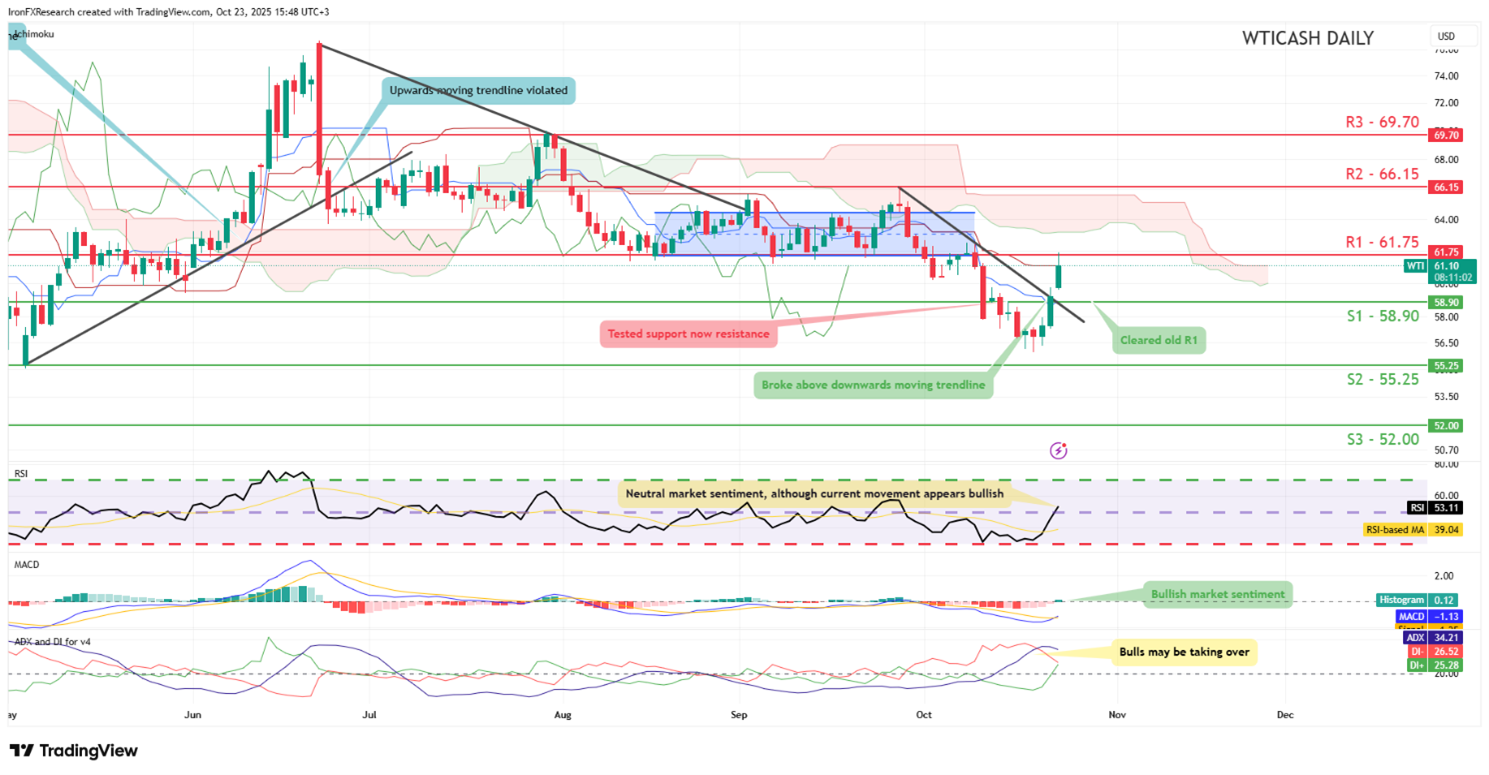
- Support: 59.50 (S1), 56.00 (S2), 51.40 (S3)
- Resistance: 62.40 (R1), 66.20 (R2), 70.00 (R3)
Since our last report WTI’s price action dropped and tended to stabilise since Tuesday as it test the 59.50 (S1) support level. For the time being, we expect the price action of the commodity to stabilise somewhat and note that the RSI indicator seems to be currently running along the reading of 50, implying a relative indecisiveness on behalf of market participants that could allow the sideways motion to be maintained.
Also we note that the Bollinger bands have narrowed, implying an easing of volatility for WTI’s price-action. Should the bears take over, we may see WTI’s price action dropping below the 59.50 (S1) support line and continue to break also the 56.00 (S2) support level.
On the flip side, should the bulls be in charge of WTI’s price action we may see it breaking the 52.40 (R1) resistance line and start aiming for the 66.20 (R2) resistance level.
Disclaimer:
This information is not considered investment advice or an investment recommendation, but instead a marketing communication. IronFX is not responsible for any data or information provided by third parties referenced or hyperlinked in this communication.


