
The US dollar continues to strengthen, supported by growing expectations that the Fed may maintain a hawkish policy stance for longer than previously anticipated. Market participants are closely watching upcoming European PMI data and US economic indicators for further clues on global growth momentum and currency direction. Meanwhile, mixed signals across equities, commodities, and energy markets highlight a cautious trading environment driven by shifting monetary policy expectations and macroeconomic uncertainty.
The USD continues to strengthen
The USD continued to strengthen boosted by hawkish expectations for the Fed’s intentions.
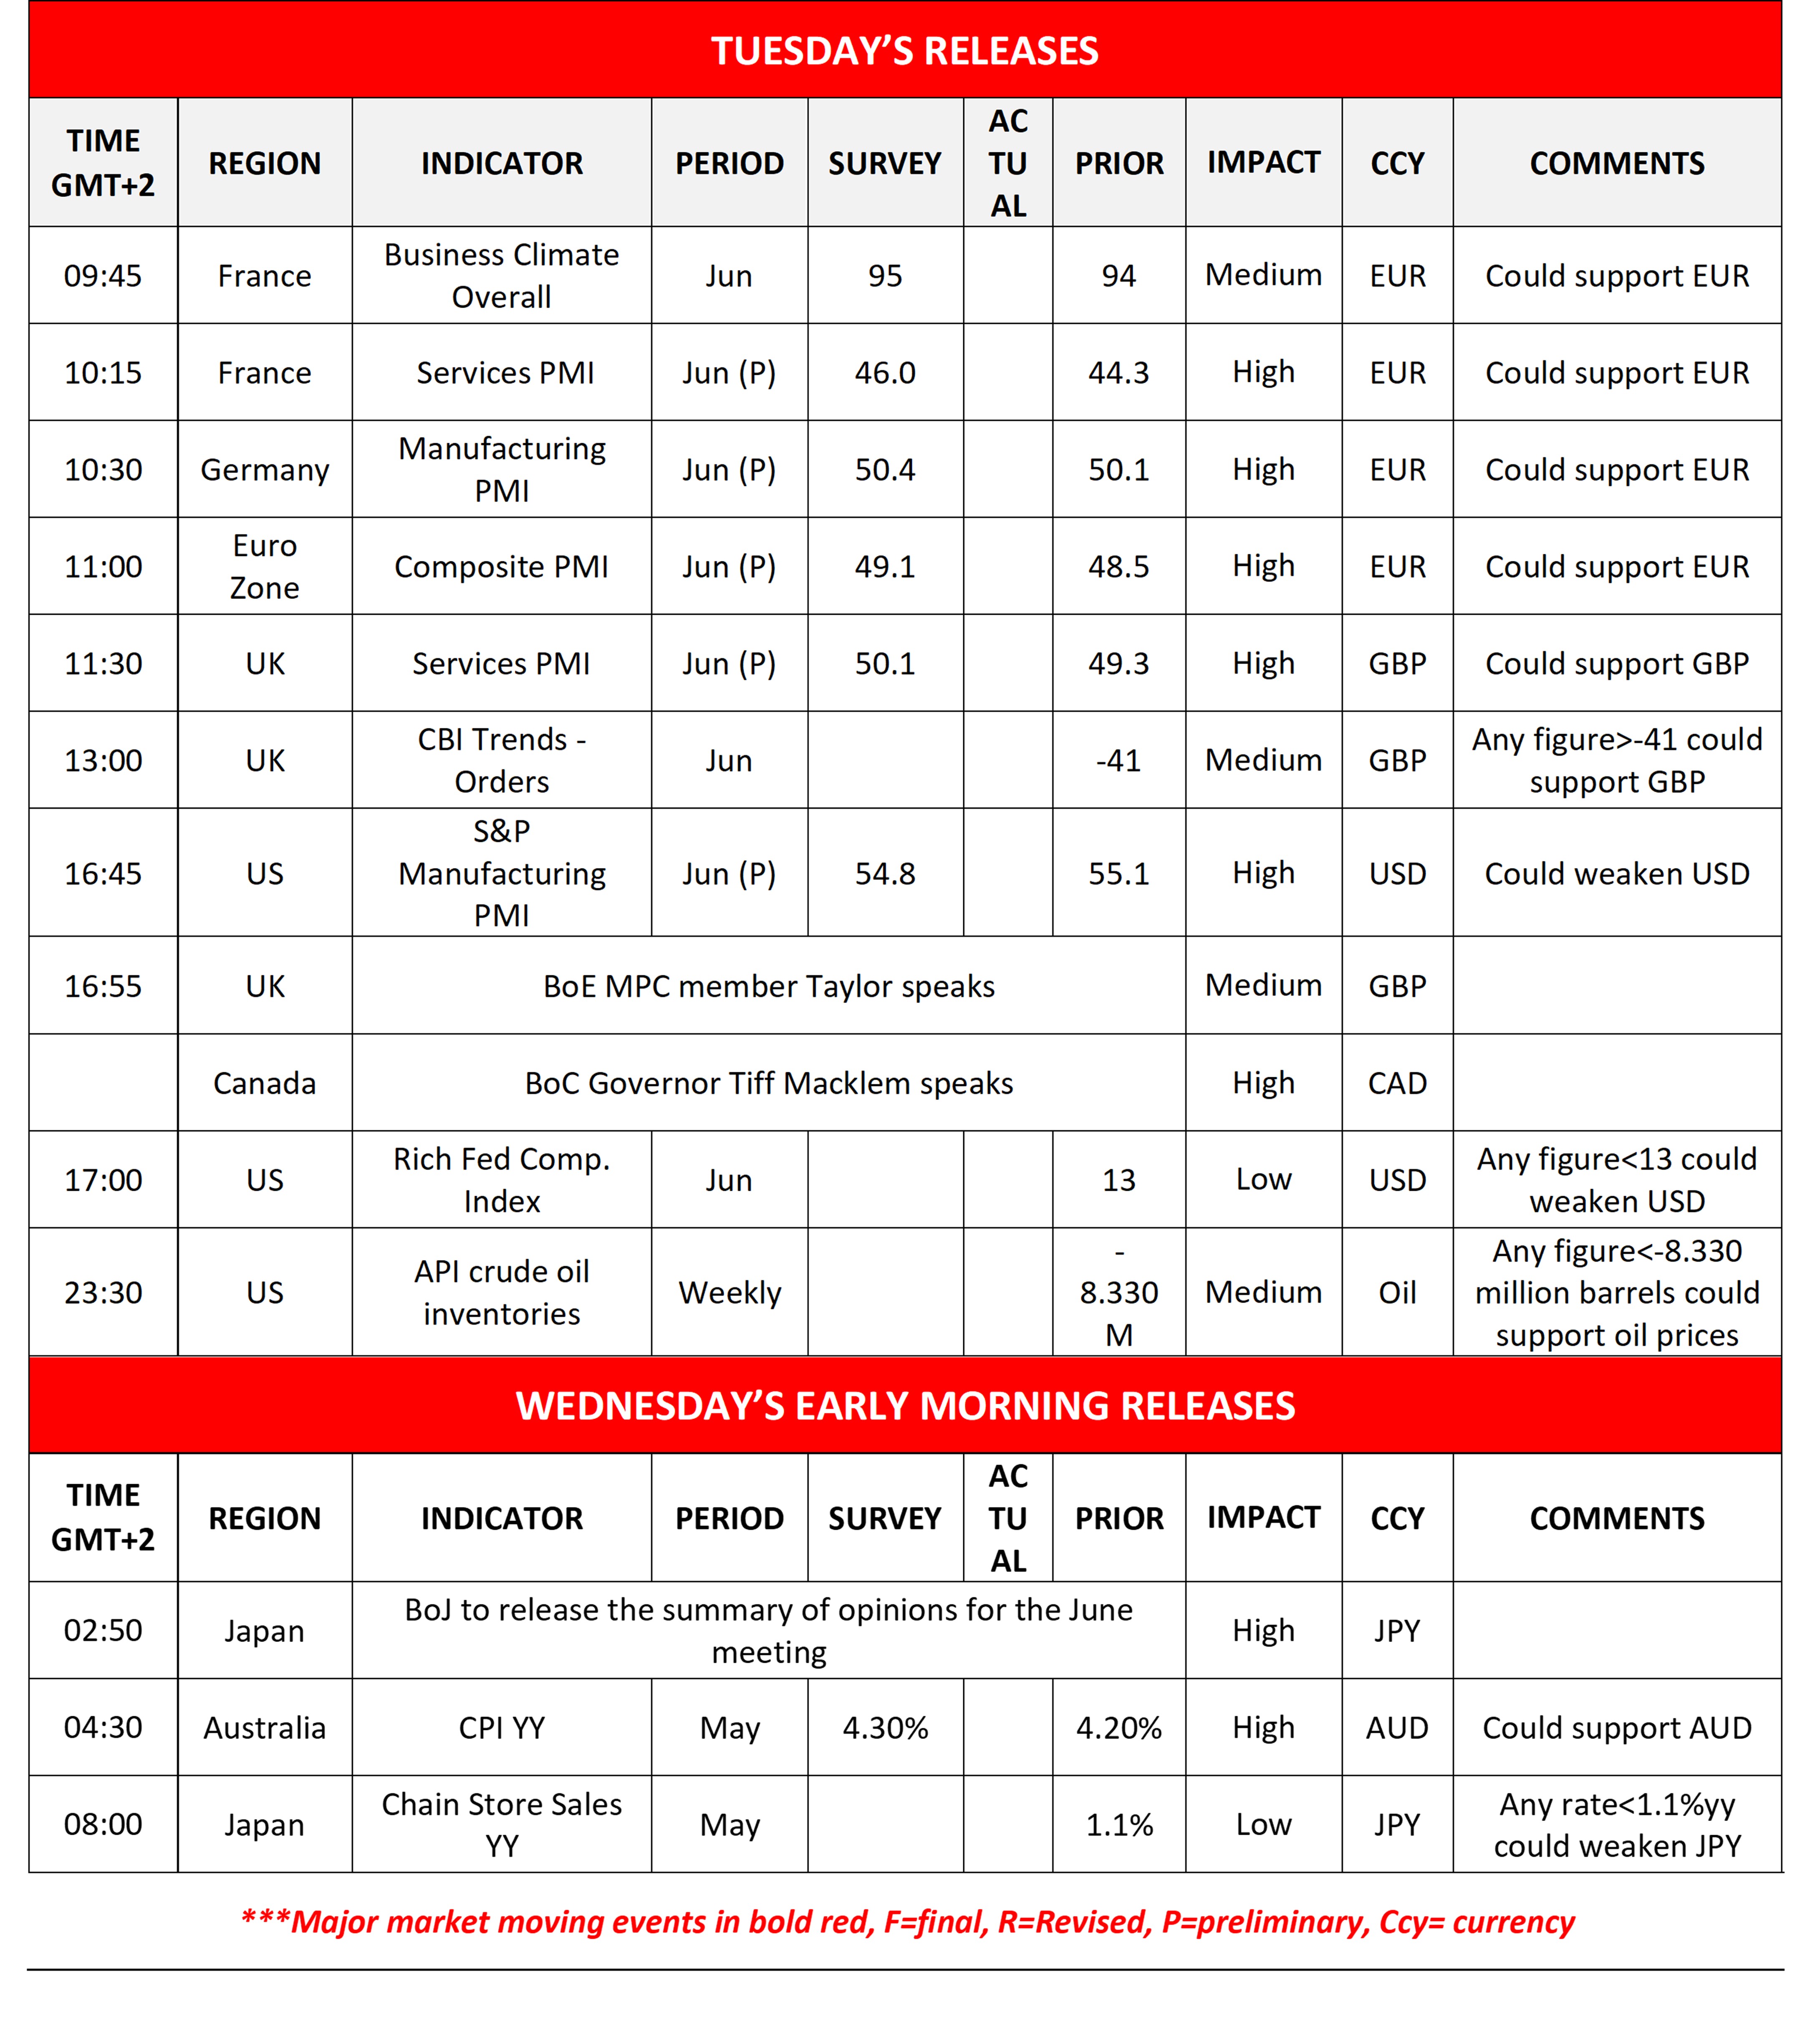
Market attention today is expected to be placed on European preliminary PMI figures for June and a possible improvement of economic activity in the area could provide support for EUR.
Also, should Australia’s CPI rates accelerate beyond market expectations we may see the Aussie getting some support.
Mixed signals from US equities
S&P 500 and Nasdaq ended their day in the reds as the market’s hawkish expectations for the Fed tended to weigh.
Declines by mega-cap tech companies like Amazon, Meta, NVIDIA and Google tended to weigh on the indexes. In the case of Alphabet the flight of key AI researchers was an additional reason for it’s 5% drop.
Also, SpaceX with plans for a mega bond of $20billion, continues to lose ground as the initial enthusiasm of the IPO fizzle’s out.
Oil prices continue to fall
Oil prices continued to fall yesterday, as signals of progress in the US-Iran negotiations spread further confidence that we are walking towards a reopening of the Straits of Hormuz and a normalization of the international oil market.
The path towards that goal remains bumpy, yet the bearish sentiment is expected to be maintained should market’s expectations for a normalization of the supply side of the oil market persist.
Gold’s bearish tendencies are renewed
Gold’s bearish tendencies were renewed yesterday as the USD continued to strengthen and weighed on the precious metal’s price. We still view the negative correlation of the USD with gold’s price as being active.
Should market expectations for the Fed to tighten its monetary policy be maintained or even intensify, we may see gold’s price ending in the reds again.
Otros destacados de hoy
Today we get the UK’s and the US’s preliminary PMI figures, France’s business climate, the UK’s CPI trends of industrial orders and the US Richmond Fed Composite index all being for June while later on we get the US weekly crude oil inventories figure.
On a monetary level, we note the release of BoE MPC member Taylor and BoC Governor Macklem speak. In tomorrow’s Asian session, we get Japan’s chain store sales, both for May, while BoJ is to release the summary of opinions for the June meeting.
Charts to keep an eye out
EUR/USD
EUR/USD continued to weaken teasing the 1.1410 (S1) support line. We remain bearish for the pair, given its direction and the bearish market sentiment indicated by the RSI indicator reaching the reading of 30. Yet the flirting off the lower Bollinger band by the pair’s price action may slow down the bears.
Should the bears remain in charge of the pair’s direction, we may see the EUR/USD breaking the 1.1410 (S1) support lien and start aiming for the 1.1265 (S2) support level. Should the bulls take over, we may see the pair bouncing on the S1, breaching the 1.1575 (R1) resistance level and opening the way for the 1.1685 (R2) resistance base.
WTI
WTI’s price continued to lose ground yesterday aiming for the 69.00 (S1) support line.
We maintain our bearish outlook for the commodity’s price, as expressed yesterday, yet note that it may have reached oversold levels and may be ripe for a correction higher.
Should the bears remain in control, WTI’s price may start break the 69.00 (S1) support line and start aiming for the for the 60.90 (S2) support level.
While for a bullish outlook, we would require WTI’s price to break the downward trendline leading it, signaling an interruption of the downward movement and continue to break also the 76.00 (R1) resistance line, paving the way, if not breaching for the 82.00 (R2) resistance level.
EUR/USD Daily Chart
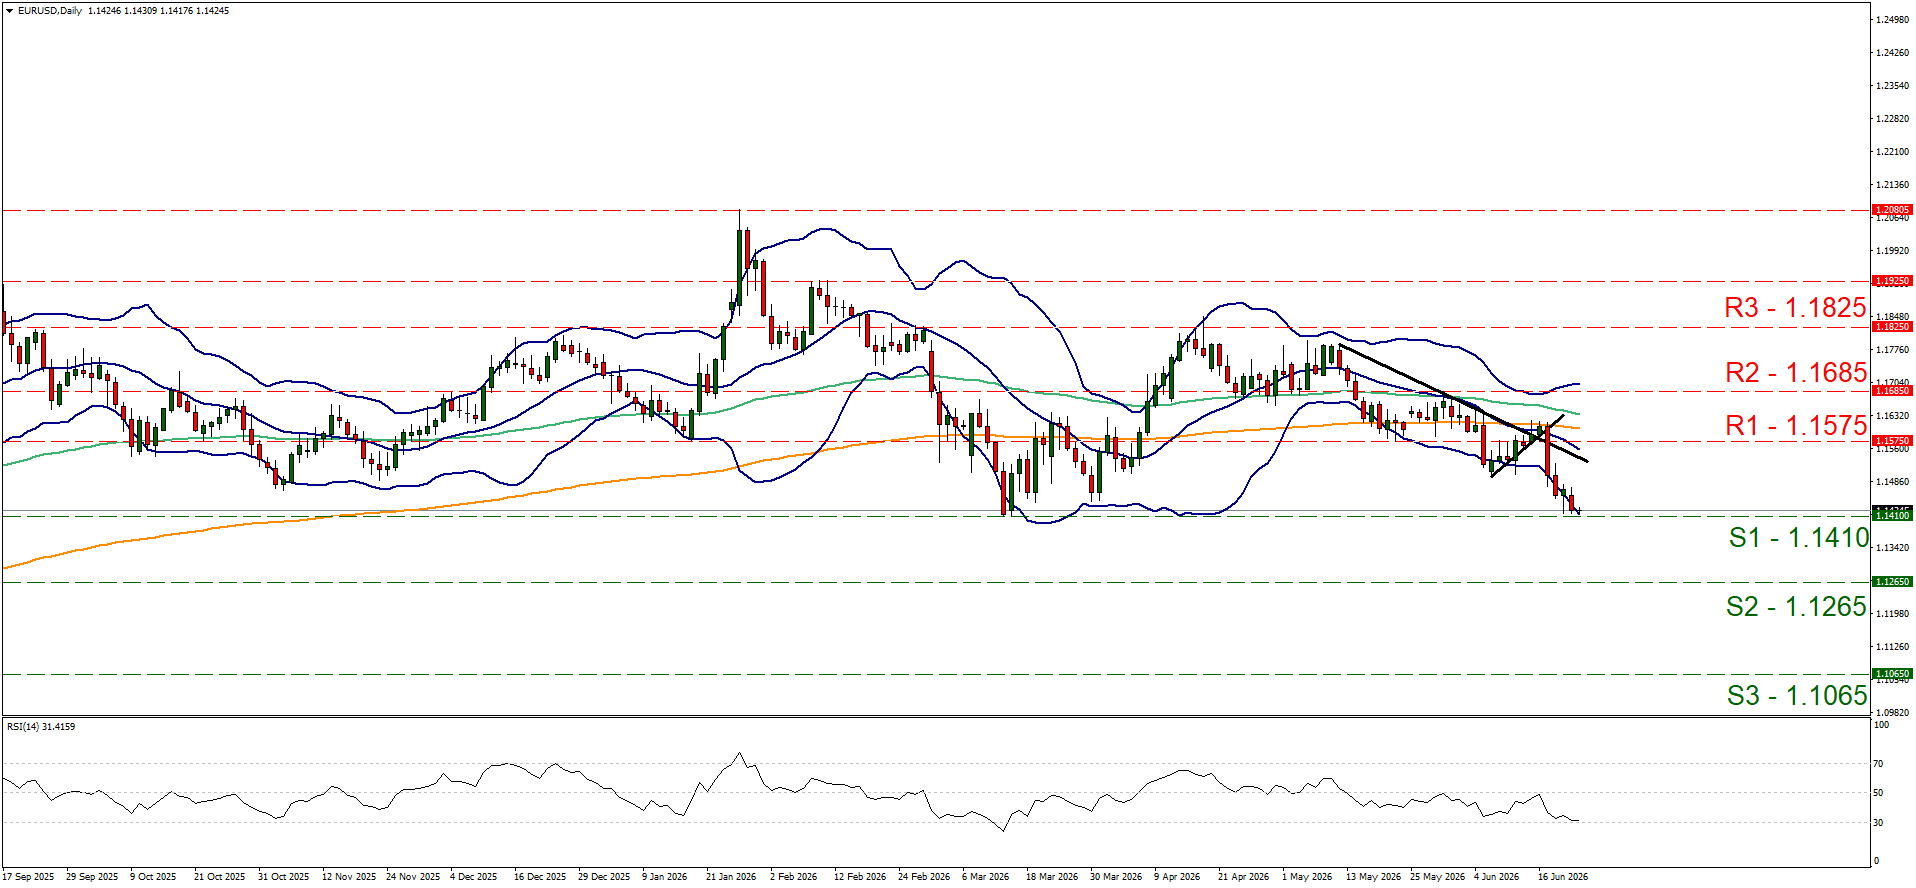
- Support: 1.1410 (S1), 1.1265 (S2), 1.1065 (S3)
- Resistance: 1.1575 (R1), 1.1685 (R2), 1.1825 (R3)
WTI Daily Chart
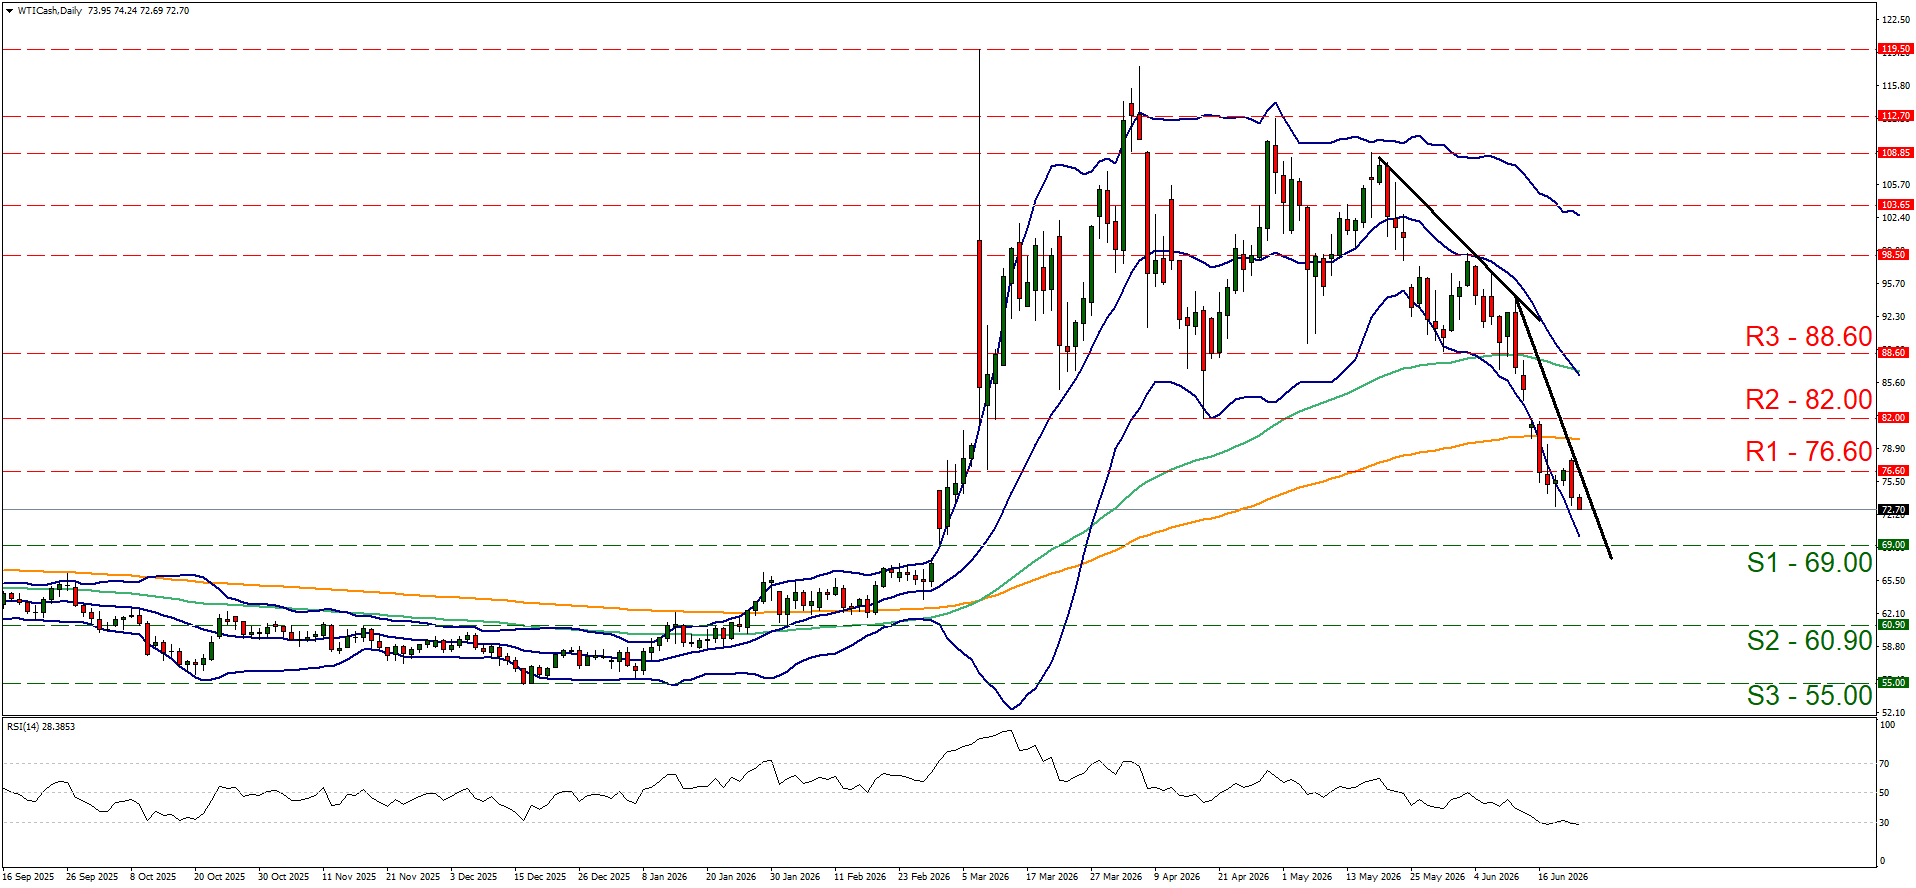
- Support: 69.00 (S1), 60.90 (S2), 55.00 (S3)
- Resistance: 76.60 (R1), 82.00 (R2), 88.60 (R3)
Descargo de responsabilidad:
Esta información no debe considerarse asesoramiento o recomendación sobre inversiones, sino una comunicación de marketing. IronFX no se hace responsable de datos o información de terceros en esta comunicación, ya sea por referencia o enlace.