 JA
JA  EN
EN  FR
FR  ES
ES  KO
KO  PT
PT  ZH
ZH  AR
AR  FA
FA  RU
RU  NL
NL  MS
MS  VI
VI  PH
PH  TH
TH  ID
ID 

JPY continues to be weak
The USD seems to be finding its footing after the long weekend and the weak US employment report for June. We still view the Fed’s intentions as the key issue on a fundamental level for the greenback and highlight the release of the Fed’s June meeting minutes on Wednesday. In the Far East, JPY is losing ground fast against the USD in todays’ Asian session relenting any gains made on Thursday. There are also wide concerns about Japanese officials stopping to signal any market intervention in an effort to hit JPY short sellers hard, through a more targeted campaign.
US equities wobble
US equities seem to be wobbling as the week begins. The intentions of the Fed are still the main driver for US equities, but also we highlight the market’s worries for possible overvaluations of tech companies. We note though that the tech sector and especially the potentials of AI technology were behind the rise of US stock markets, over the past two quarters, but the sector has swung substantially over the past two weeks. The release of the Fed’s meeting minutes next Wednesday could provide substantial volatility for US equities, depending on the tone characterising the document. A possibly hawkish tone could weigh on US stock markets while a dovish tone could provide some support.
本日のその他の注目点
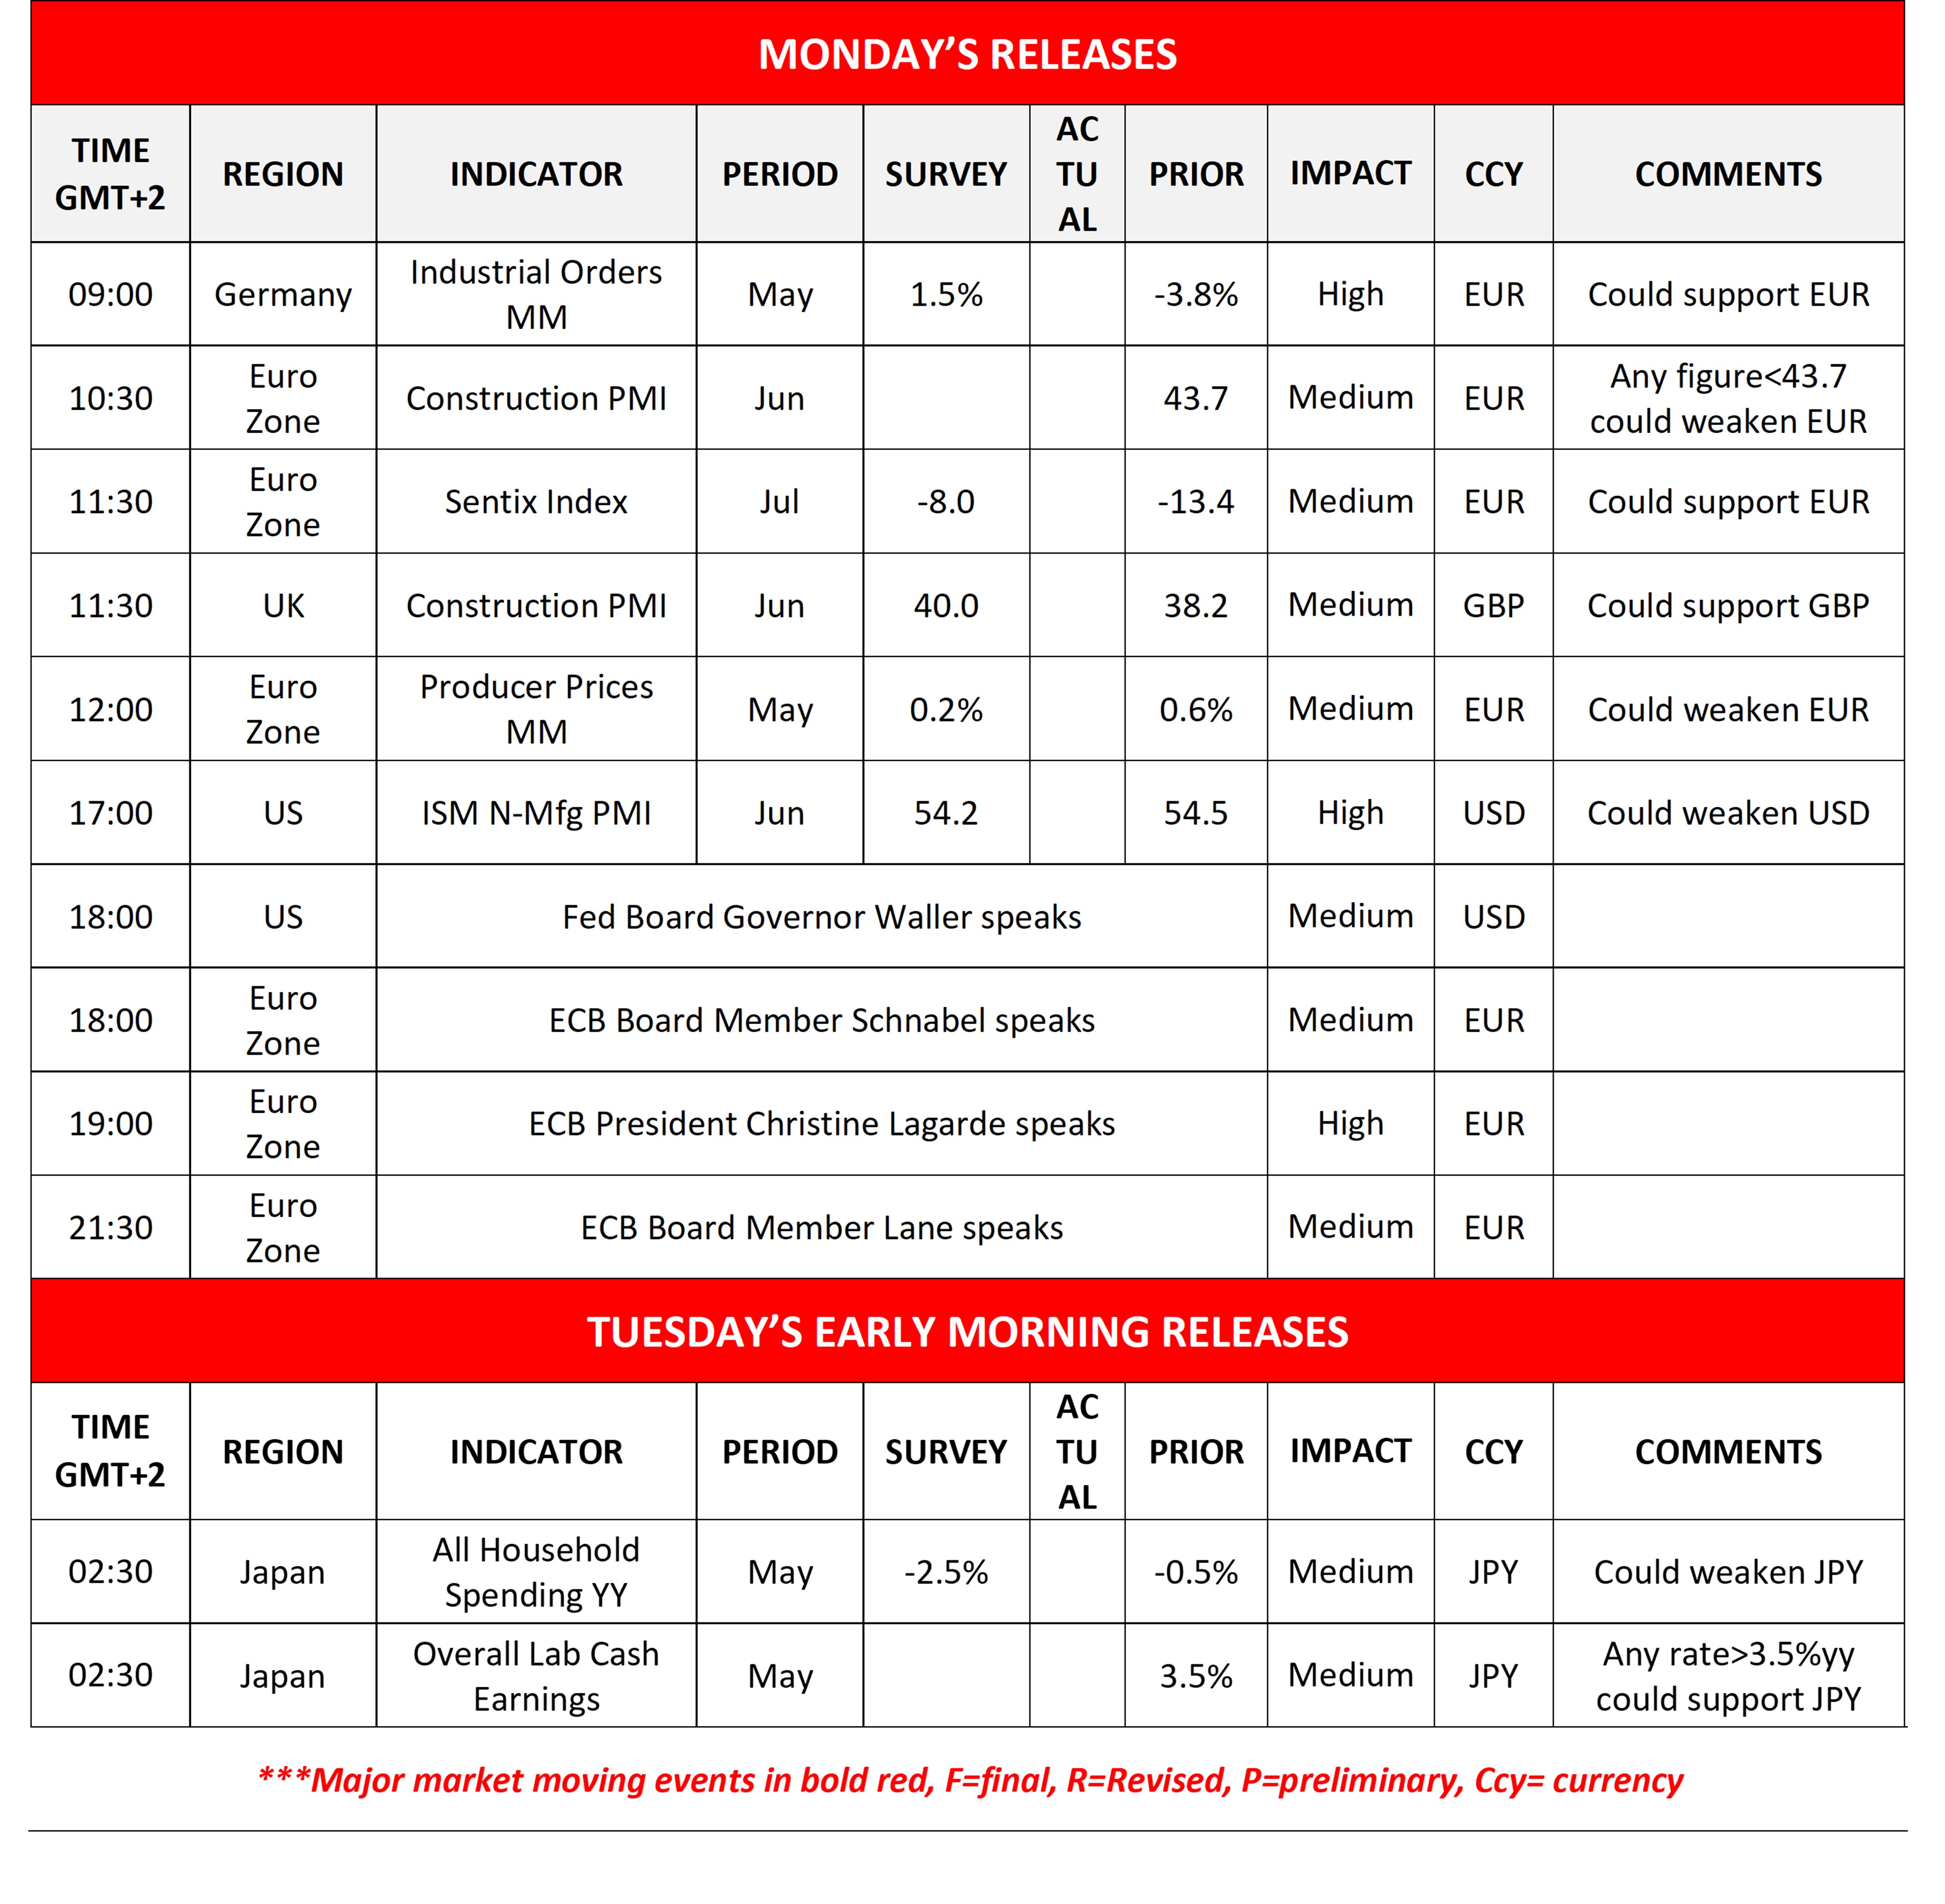
Today we get Germany’s industrial orders for May, Euro Zone’s construction PMI for June and Sentix index for July, UK’s construction PMI for June, Euro Zone’s PPI rates for May and on a monetary level, we note that Fed board Governor Waller, ECB board member’s Schnabel and Lane and ECB President Christine Lagarde are scheduled to speak. In tomorrow’s Asian session, we get Japan’s All Household spending and Overall Labour Cash earnings both being for May.
今週の指数発表
On Tuesday we get Germanys’ industrial output for May, UK’s Halifax House Prices for June, the Czech Republic’s preliminary CPI rates for June and Canada’s trade data for May. On Wednesday we get Japan’s current account balance for May, from New Zealand, RBNZ’s interest rate decision, Sweden’s CPI rate for June and GDP rates for May, and we highlight the release of the Fed’s June meeting minutes. On Thursday we get China’s inflation metrics, and the weekly US initial jobless claims figure. On Friday we get Japan’s PPI rates, Norway’s CPI rates, and Canada’s employment data, all being for June.
Charts to keep an eye out
After Thursday’s abrupt movement we were forced to readjust the first resistance levels of USD/JPY. The pair moved higher after bouncing on the 160.50 (S1) support line. We still maintain a bias for a sideways motion of the pair yet note that a bullish market sentiment is re-emerging for USD/JPY, which in turn could generate bullish market tendencies for the price action. Should the bulls renew their dominance over the pair’s direction, we may see USD/JPY breaching the 162.80 (R1) resistance line and start aiming for the 165.50 (R2) resistance level. Should the bears fully take over, we may see USD/JPY breaking the 160.50 (S1) support line and start aiming for the 157.50 (S2) support level.
Dow Jones seems to be stable as the markets reopen, just above the 52685 (S1) support line. The upward trendline remains intact, as does bullish market sentiment for the index, given the position of the RSI indicator, hence we maintain our bullish outlook for the index. Should the bears regain control over WTI’s price we may see it nearing the 60.90 (S1) support line. Should the bulls take over we may see WTI’s price breaking the 60.90 (R1) resistance line and start aiming for the 76.60 (R2) resistance level.
USD/JPY Daily Chart
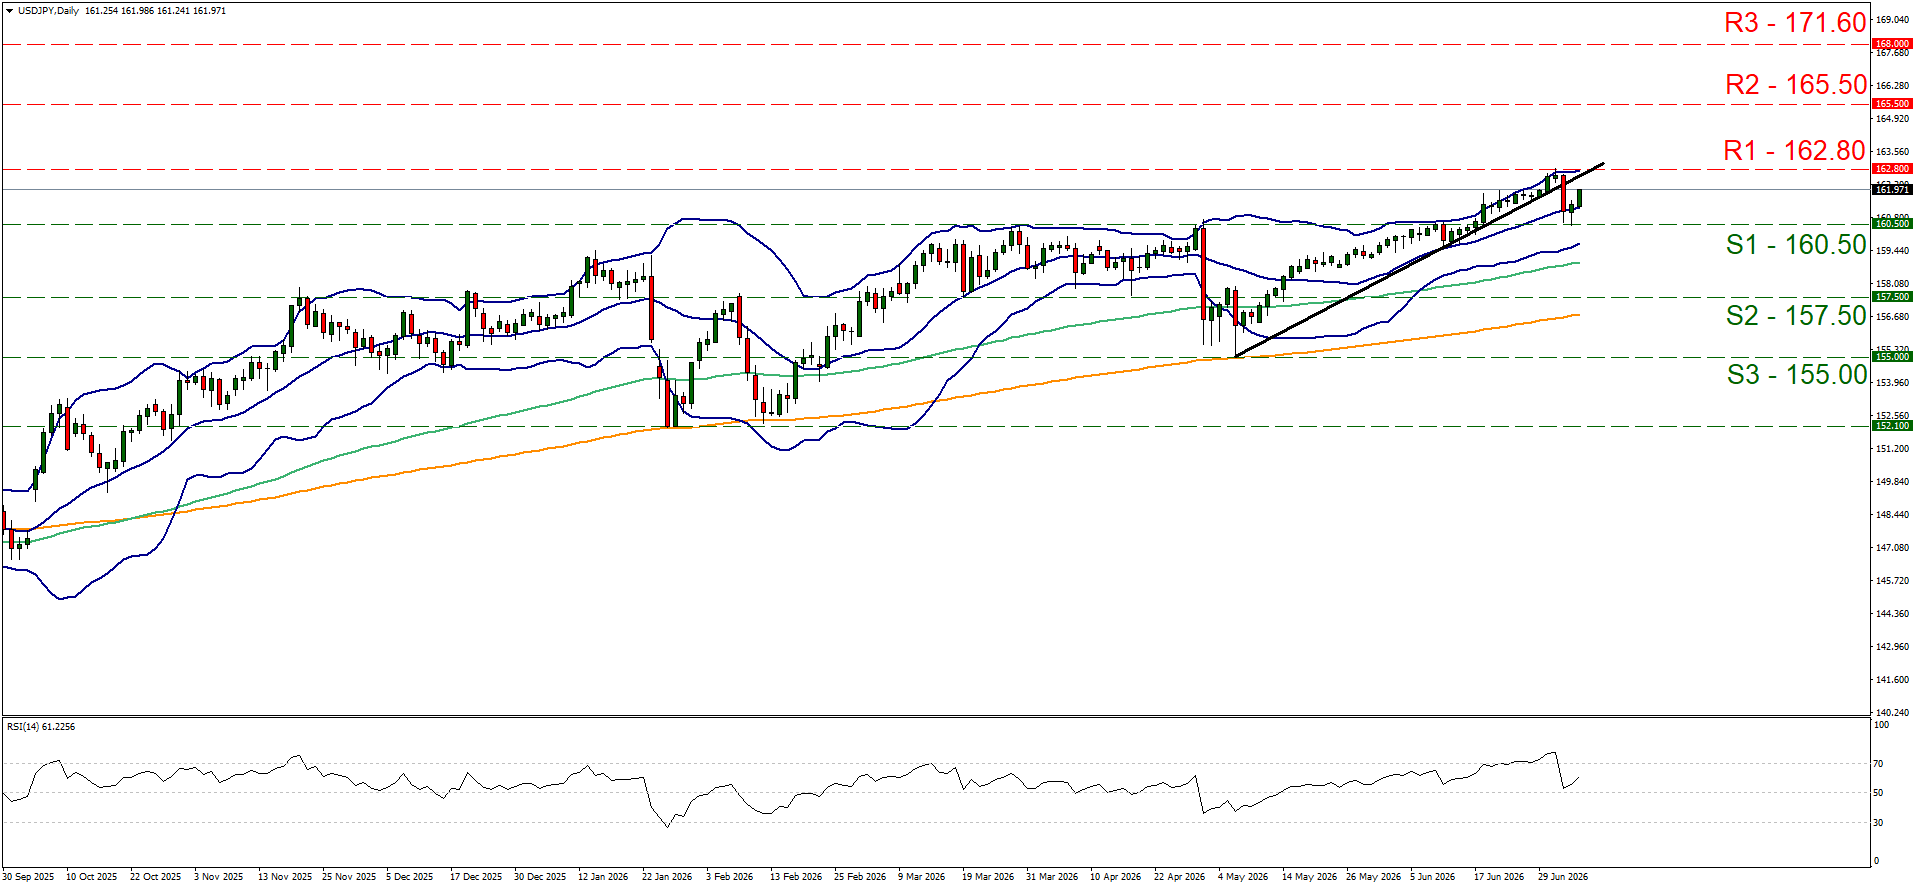
- Support: 160.50 (S1), 157.50 (S2), 155.00 (S3)
- Resistance: 162.80 (R1), 165.50 (R2), 171.60 (R3)
US30 Cash Daily Chart
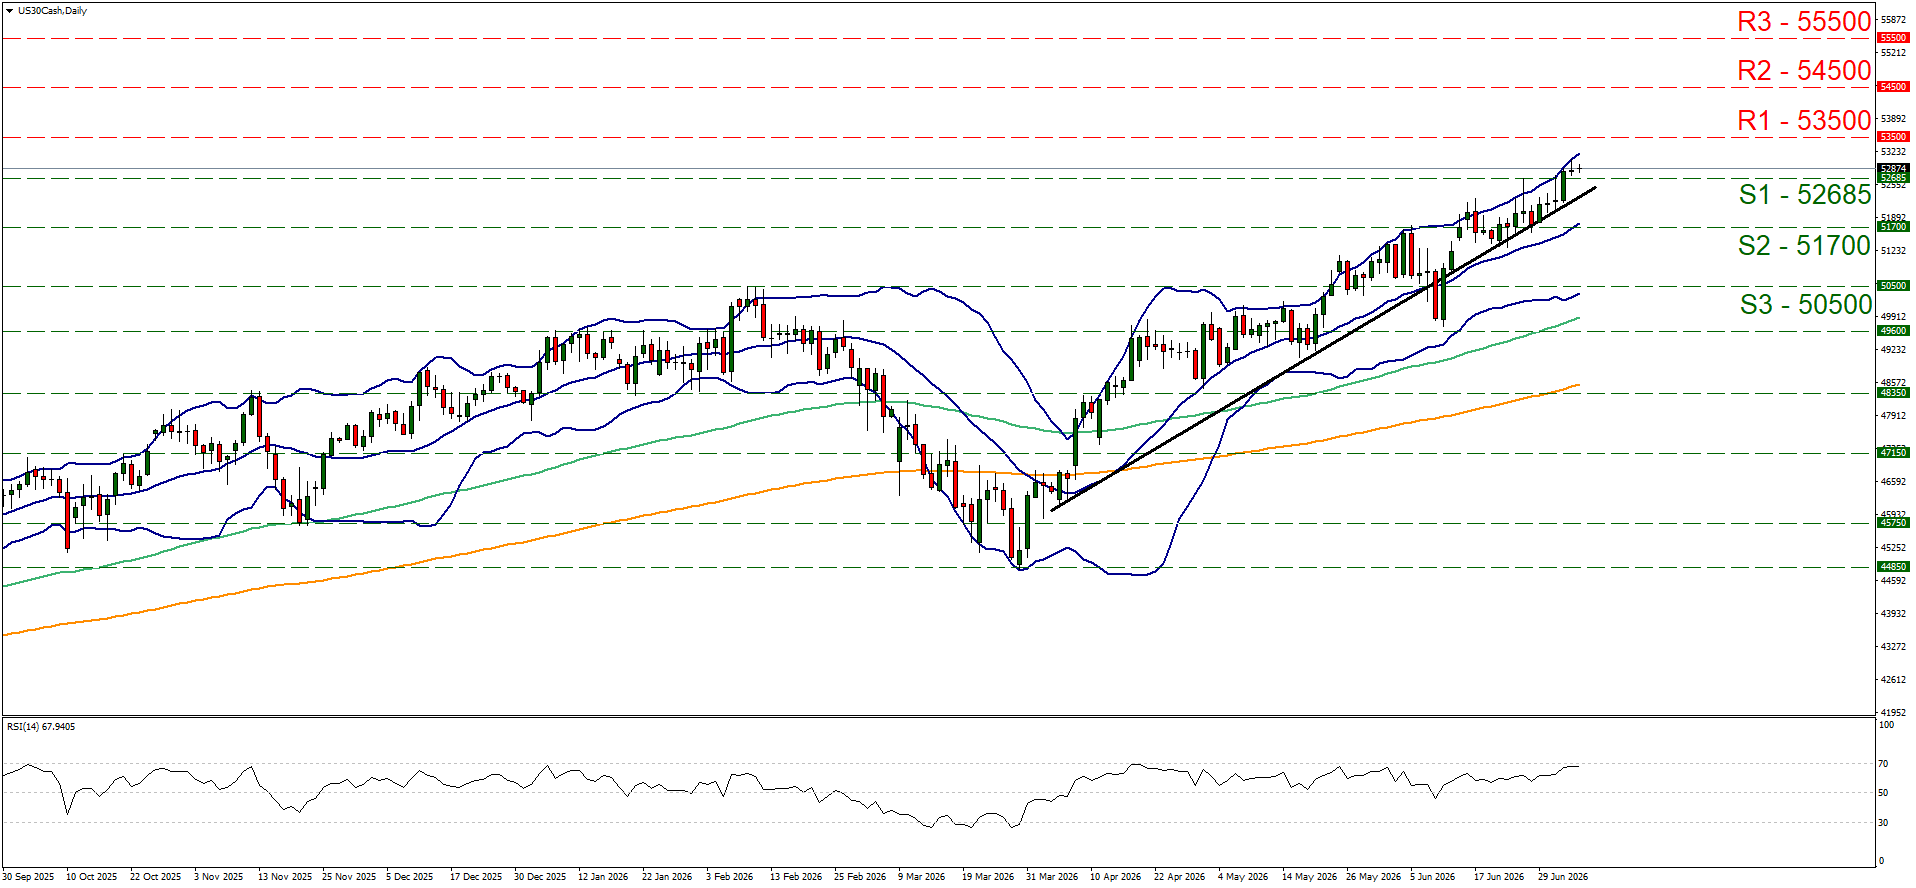
- Support: 52685 (S1), 51700 (S2), 50500 (S3)
- Resistance: 53500 (R1), 54500 (R2), 55500 (R3)
免責事項:
本情報は、投資助言や投資推奨ではなく、マーケティングの一環として提供されています。IronFXは、ここで参照またはリンクされている第三者によって提供されたいかなるデータまたは情報に対しても責任を負いません。


