 NL
NL  EN
EN  FR
FR  ES
ES  JA
JA  KO
KO  PT
PT  ZH
ZH  AR
AR  FA
FA  RU
RU  MS
MS  VI
VI  PH
PH  TH
TH  ID
ID 

Since our last report Gold’s price, appears to be moving in a downwards trajectory. In today’s report we are to discuss mainly fundamental issues and we intend to end the report with a technical analysis of Gold’s daily chart.
FOMC minutes to be released this week
The FOMC minutes for their September meeting are set to be released this week. The minutes are set to showcase insight into the bank deliberations in the previous meeting in which they hiked rates by 25 basis points. Therefore, market participants may be looking forward to the release of the minutes in order to garner clues into the bank’s next possible decisions moving forward. Thus, should the bank’s minutes showcase a clear willingness to hike rates in their next meeting it could provide some support for the greenback and vice versa. Yet, considering the softer inflation and employment data that was released last week, participants may be looking for more than just an indication that the bank could hike rates, in order for the market to be swayed by the minutes. Nonetheless, on a general level an aggressive tone in the minutes may provide support for the greenback and vice versa.
NFP figure disappoints traders
Following the softer-than-expected employment data on Friday, which was the NFP figure came in much lower than expected at 29k versus 89k and much lower than the prior figure of 133k, thus implying a softening labour market. The NFP figure may increase pressure on the Fed to withhold from hiking rates in their next meeting, which could weigh on the greenback whilst aiding gold’s price considering the inverse relationship between the two assets.
UoM consumer sentiment figure to be released on Friday
The US University of Michigan (UoM) preliminary consumer sentiment figure is set to be released this Friday. The indicator provides insight into consumers’ confidence in the economy, which can influence their willingness to spend and, consequently, overall consumption and economic activity. As a result, the measure is closely watched by markets. A stronger-than-expected reading could signal greater consumer confidence and potentially stronger spending, which may support expectations for economic activity and, depending on the broader macroeconomic backdrop, provide support for the US dollar, whilst weighing on gold’s price and vice versa.
TECHNISCHE ANALYSE
XAU/USD Daily Chart
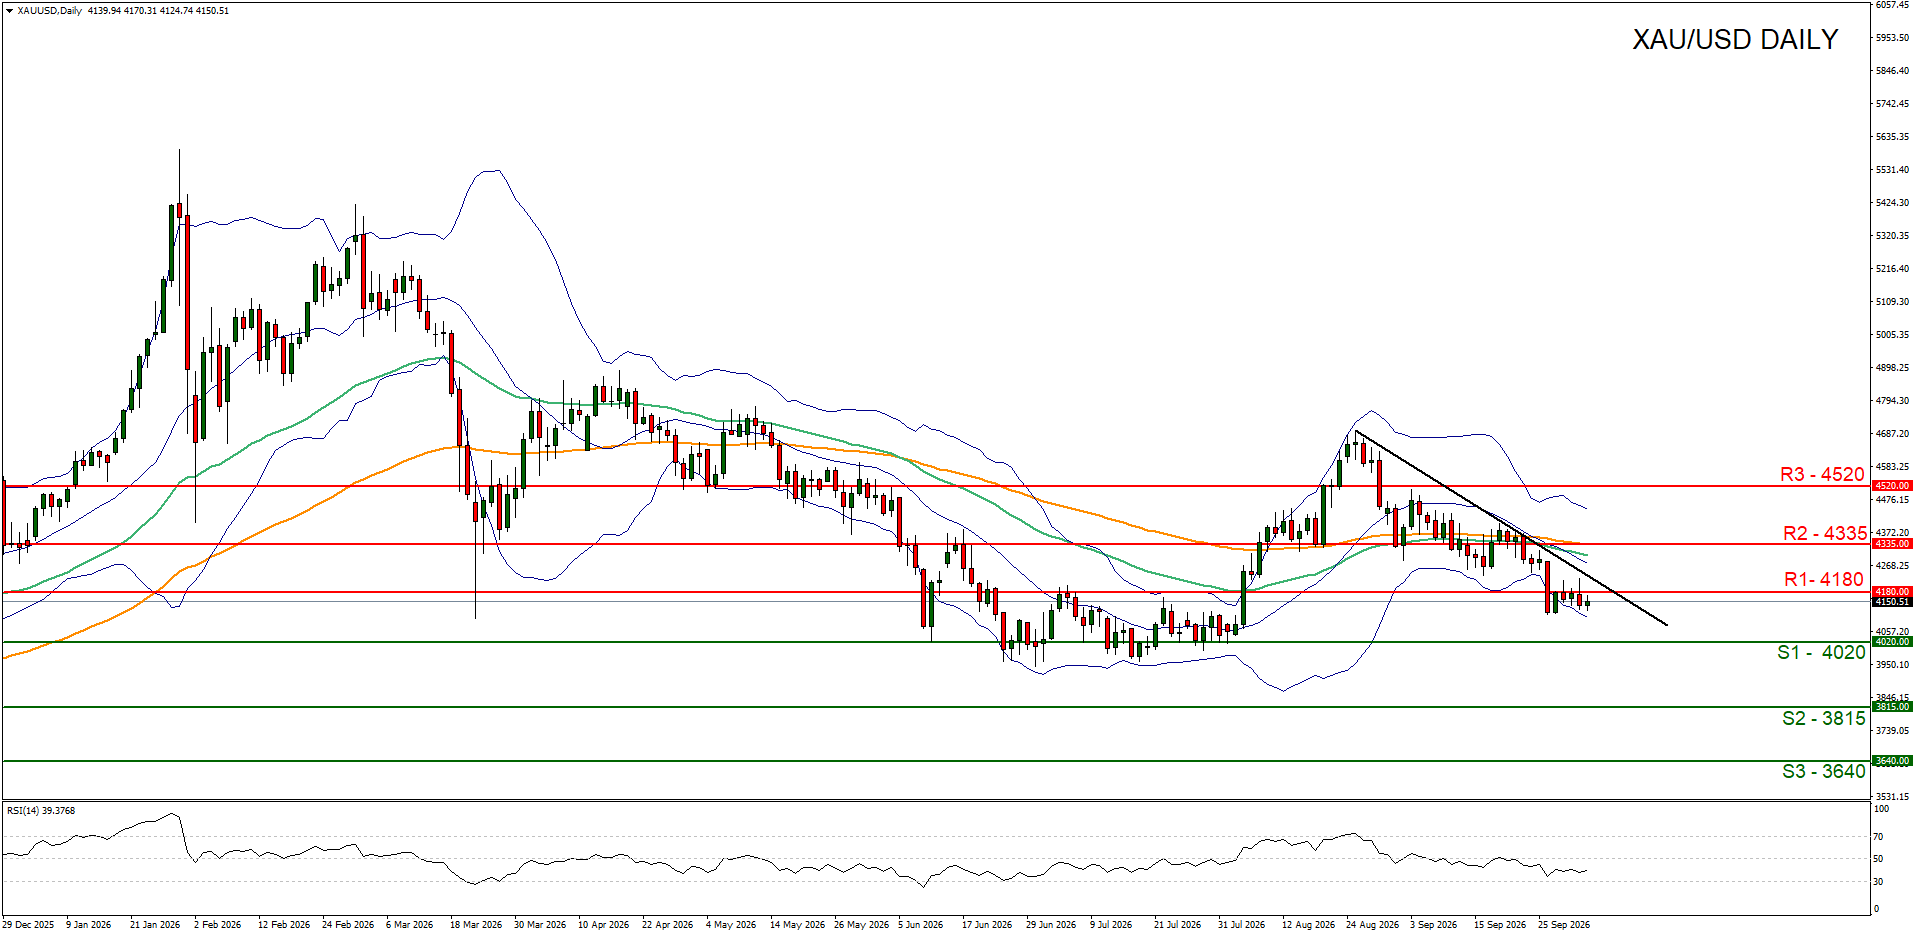
Resistance: 4180 (R1), 4345 (R2), 4520 (R3)
Gold’s price appears to be moving in a downwards fashion after clearing our support turned to resistance at our 4180 (R1) level. We opt for a bearish outlook for the precious metal’s price and supporting our case is the RSI indicator below our chart, which currently registers a figure below 40, implying a strong bearish market sentiment. For our bearish outlook to continue we would require a break below our 4020 (S1) support level, with the next possible target for the bears being our 3815 (S2) support base. On the other hand, for a sideways bias we would require gold’s price to remain confined between our 4020 (S1) support level and our 4080 (R1) resistance line. Lastly, for a bullish outlook we would require a clear break above our 4180 (R1) resistance level, with the next possible target for the bulls being our 4335 (R2) resistance line.


